Dynamics

|
Generational Dynamics |
| Forecasting America's Destiny ... and the World's | |
| HOME WEB LOG COUNTRY WIKI COMMENT FORUM DOWNLOADS ABOUT | |
 |
At the beginning of 2004, there seems to be just no stopping the stock market. The Dow Jones Industrial Average (DJIA) is above 10,500, the S&P 500 index is above 1100, and the Nasdaq index is above 2000. Today (1/2/2004), the indexes are going even higher.
Probably the angriest critics I have are those who ridicule my prediction that we're in the midst of another 1930s style Great Depression, and that stock prices will fall substantially within the next few years.
I, on the other hand, find myself astounded by the Alice in Wonderland world of financial analysts who predict that stock prices will continue to rise.
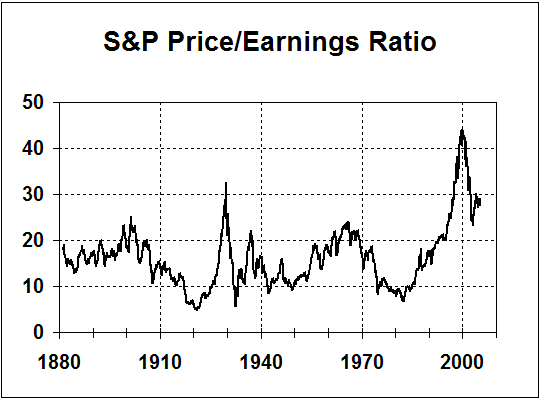
If a company is earning $1 per stock share per year, historically investors have been willing to pay $10-$15 for that share of stock. In other words, the Price/Earnings Ratio (P/E Ratio) has historically averaged 10-15. So the P/E ratio tells you what the price of the stock should be, based on the company's earnings. If the P/E ratio is higher than 15, the stock is probably overpriced; if it's below 10, the stock is probably underpriced.
 |
Take a look at the adjoining graph, which shows the historical average P/E Ratios for the S&P 500 stocks back to 1881. As you can readily see, any time in the last century the P/E Ratio went above 20, it fell below 10 a few years later.
Now, for some reason that's totally beyond me, many analysts think that this time will be different. Why? No solid reasons are ever given. These analysts appear to me to be in a state of denial.
There is absolutely no reason to believe that the average P/E Ratio won't drop below 10 in the next couple of years, representing something like a 50% fall in stock market prices.
 |
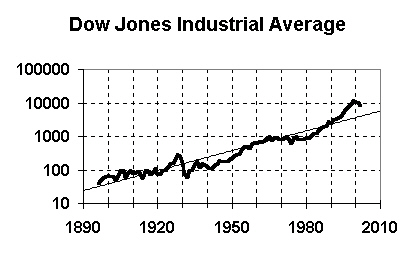
Now take a look at the next graph. It shows the Dow Jones Industrial Average (DJIA) for the last century, plotted on a logarithmic scale along with an exponential growth trend line. This is a standard trend forecasting technique used to forecast all sorts of financial and technological values. (For lots more discussion and examples, see Chapter 11 of my Generational Dynamics book. You'll also find a similar graph for the S&P 500 index.)
As you can see, the DJIA spiked above the trend line in the 1920s and fell below the trend line in the 1930s. Similarly, the DJIA spiked above the trend line in the 1990s.
There is absolutely no reason to believe that the DJIA will not drop below the trend line again, as it has several times in the past.
The trend value in 2010 is just below 6000, around 5800. If the DJIA follows history -- and you can be certain it will -- then it will have to spike below the trend line, to the 4000 range. This should happen within the next two or three years.
The above paragraphs use two very different forecasting techniques that lead to the same conclusion:
Both of these techniques lead to the same conclusion: That stock prices are going to drop by some 50% in the next few years.
Now look: Some people agree with this forecast, some don't. For those who don't, my message to you is the following: This is not a wild, crazy forecast. It's a forecast based on widely-used forecasting techniques that everyone believes in, except when they produce forecasts that people don't like.
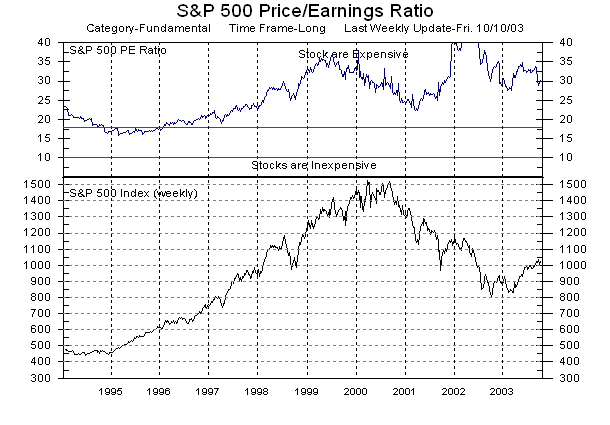
Finally, look at the graph on the bottom of this web page, which shows the average P/E ratio for the last ten years. As it shows, stocks have been historically overpriced ever since the tech bubble began in 1995. It's foolish to believe that a sharp fall can't possibly occur.
 |