|
|


|
Bubbles and Global Financial Crisis - 1995-Present
 |
Tech bubble |
 |
Real estate and credit bubbles |
 |
Financial crisis |
 |
Eurozone deterioration |
 |
Price/Earnings ratios |
|
|
|


|
The Tech Bubble of the late 1990s
 |
Tech bubble began in 1995 |
|
- |
Why did it occur at all? |
|
- |
Why did it occur then - vs. 1985 or 2005? |
|
- |
International real estate bubble also began in 1995 |
|
- |
Economists have no explanation |
|
- |
Blaming Greenspan/2003 is not credible |
 |
Mainstream economists can't explain anything since 1995 |
|
- |
Can't explain tech bubble |
|
- |
Can't explain real estate bubble |
|
- |
Can't explain credit bubble |
|
- |
Didn't foresee the financial crisis |
|
- |
Didn't foresee where we are today |
|
- |
Have no idea what's going to happen next |
 |
Pending crises |
|
- |
Europe: Greece, Ireland, Portugal, Spain, Italy, Belgium |
|
- |
China: Massive real estate bubble about to pop |
|
- |
U.S.: Federal, state debt. Pensions bankrupt. |
|
|
|


|
Price/Earnings ratios
|
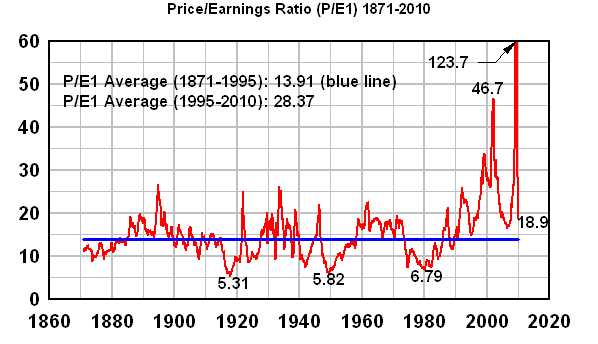 |
S&P 500 Price/Earnings Ratio (P/E1) 1871 to August 2010
|
 |
Price/Earnings ratios |
|
- |
Stock price / last 12 months' reported earnings |
|
- |
Well above average (13.91) since 1995 |
|
- |
WSJ: Current (5/20/2001) S&P 500 P/E ratio: 16.58 |
|
- |
Apply the Law of Mean Reversion |
 |
Continuing fraud |
|
- |
Fraud: 'Operating earnings' or 'forward earnings' |
|
- |
Became common after the 1990s tech bubble |
|
- |
Named names on my web site |
|
|
|


|
Generational credit bubbles
 |
How money is 'created': Securitization of debt |
|
- |
Tulipomania - 1637 - Tulip future share |
|
- |
South Sea Bubble - 1621 - South Sea shares |
|
- |
Bankruptcy of French Monarchy - 1789 - 'assignats' |
|
- |
Panic of 1857 - Railway Shares |
|
- |
1929 - Foreign bonds and stock shares |
|
- |
2000s - Synthetic securities (CDSs, CDOs, IRSs) |
 |
Collapse of bubble |
|
- |
Huge deflationary spiral |
|
|
|


|
Generational pervasiveness of bubble fraud
 |
Pervasiveness of fraud |
|
- |
Homeowners lied on their applications |
|
- |
Construction firms colluded with appraisers, got kickbacks |
|
- |
Construction firms colluded with brokers, got kickbacks |
|
- |
Lenders resold mortgages without verifying claims |
|
- |
Lenders adopted predatory lending practices |
|
- |
Lenders gave loans to people with no hope of repaying |
|
- |
'Financial Engineers' created synthetic securities |
|
- |
Synthetic securities were mathematically fraudulent |
|
- |
Investment models assumed real estate would rise forever |
|
- |
Ratings firms took fat fees to lie about AAA ratings on securities |
|
- |
Monoline firms took fat fees to insure fraudulent securities |
 |
Only explanation is generational |
|
- |
Incompetent, greedy Boomer bosses, cooperating with |
|
- |
Nihilistic, greedy Gen-X perpetrators |
|
|
|


|
DJIA - 1900 to 2010
|
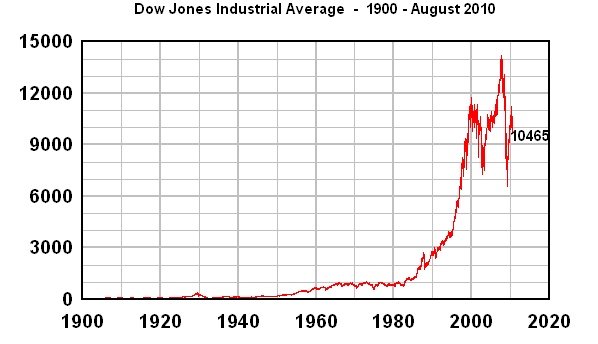 |
Dow Jones Industrial Average -- 1900 - present
|
|
|
|


|
DJIA - 1900 to 2010 + exponential growth
|
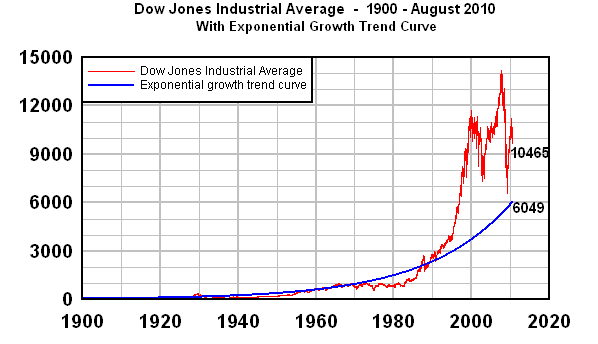 |
Dow Jones Industrial Average -- 1900 - present - with exponential growth trend curve
|
|
|
|


|
DJIA - 1900 to 2010 + exponential growth on log scale
|
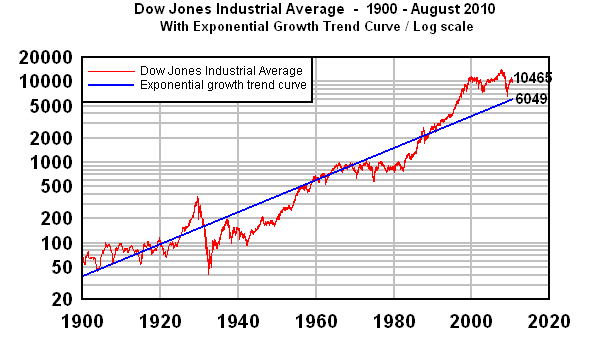 |
Dow Jones Industrial Average -- 1900 - 1950 - with exponential growth trend curve / log scale
|
|
|
|


|
Generational euphoria / denial
|
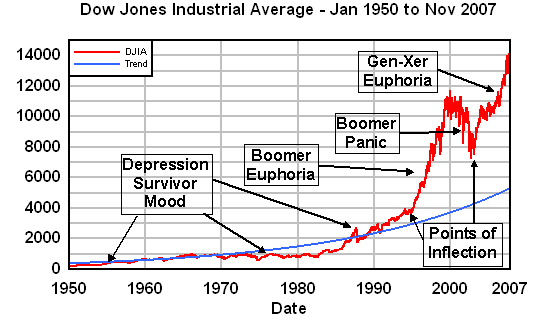 |
Generational 'moods' overlaying Dow Industrials since 1950
|
 |
1970s models, 1990s models are irrelevant today |
|
- |
Economics of the Maginot Line |
 |
Boomers and Generation-Xers |
|
- |
'Financial engineering' programs - 1990s |
|
- |
Greed+Incompetence with Greed+Nihilism |
|
|
|


|
Global Real Estate Bubble
|
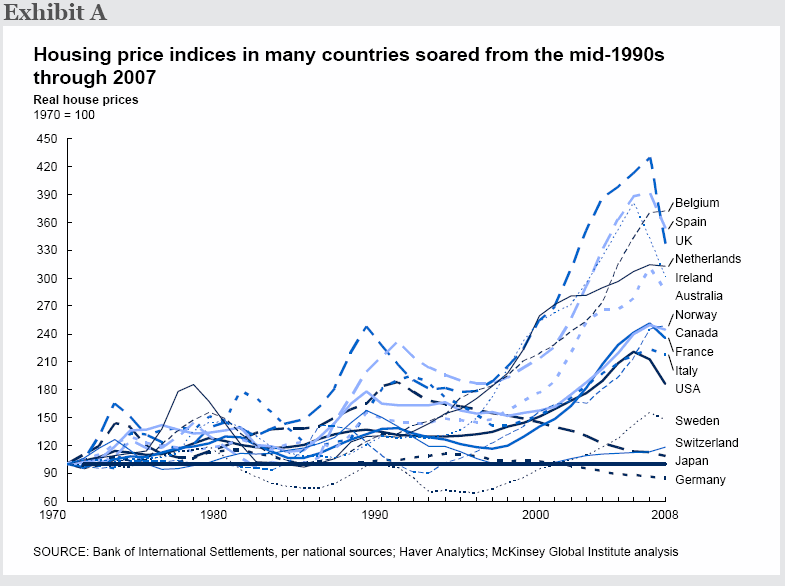 |
Housing price index in various countries, 1970-2008
|
|
|
|


|
Tobin's q and Shiller's CAPE
|
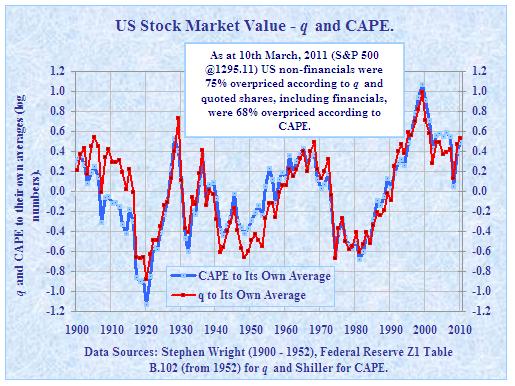 |
Tobin's q and Shiller's CAPE indexes (Smithers & Co.)
|
|


