|
&& Crisis War Introduction - Generational Dynamics
The basic principle underlying Generational Dynamics is that there are two kinds of wars: crisis (or generational) wars versus non-crisis (or mid-cycle) wars.
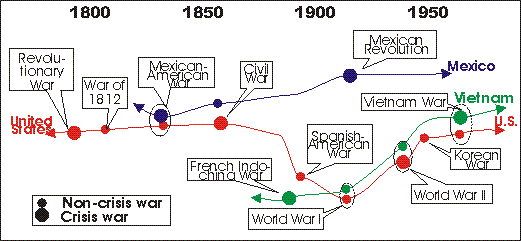
The following graphic illustrates depicts both kinds of wars in America's history:
 |
What's the difference between crisis and non-crisis wars? Crisis wars are the most vengeful, most energetic, most genocidal wars that a society fights. Here are some examples:
These are all examples of crisis wars. They vengeful, they have the unstoppable energy of a raging typhoon, and they're genocidal.
What we'll be showing is the following: That a country has a crisis war every 80 years or so -- at exactly the time that the generation of people who lived through the last crisis war, and have a personal memory of it, all disappear (retire or die), all at approximately the same time.
The interval 80 years is only approximate, and it represents the approximate length of a maximum human lifespan (which has been fairly constant for millennia). In actual practice, most crisis wars are 70-90 years apart, and occasionally they're as little as 60 or as many as 100 years apart. In the hundreds of cases I've looked at, there has never been a case where a new crisis war began less than 50 years after the end of the previous one.
Thus, on the American timeline, the Civil War occurred 86 (=1861-1775) years after the Revolutionary War, and World War II began 80 (=1941-1861) years after the Civil War.
"What about World War I," you predictably may ask. We will have a great deal to say about World War I later, but for now: Most people don't understand WW I. Most people assume that WW I and WW II are similar. They are not. WW I was mainly an East European war, and WW II was a West European war. America was not energetic, not vengeful, not genocidal in WW I, as it was later in WW II. WW I was a mid-cycle war for America, as we'll discuss in detail later.
&&2 Summary of Generational Dynamics Theory
The previous graphic shows the crisis and non-crisis wars for America during the last two centuries.
Now let's expand the graphic by adding Mexico and Vietnam to it:
 |
(We are not displaying all wars in other countries; to do so would make the diagram too complex to read.)
This graphic shows some interactions between America and the other two countries.
In 1848, Mexico and the U.S. fought the Mexican-American war. This was a minor war for the U.S., which is why we've labeled it a non-crisis war.
But from Mexico's point of view, this was no minor war. Mexico was invaded an occupied by American forces, and dealt with several internal uprisings, including a war with Mayan Indians in the Yucatan, culminating in a massive peasant revolt in Queretaro.
This illustrates a very important point: That two countries might fight in the same war, but the war can look very different to them.
In order to understand Generational Dynamics, you have to do something most people don't do: You have to look at things from the point of view of other people, other nations. You can read the history of almost any war ever, and the description from the different sides will make it seem like different wars.
So later we'll be describing how to evaluate a war to determine whether it's a crisis or non-crisis war, and it will be necessary to evaluate the war separately for each country fighting in the war.
Returning now to the last graphic, we can see that the Mexican-American war was a crisis war for Mexico, and that the next crisis war was the Mexican Revolution, which began 64 (=1911-1846) years after the Mexican-American revolution,
The same kind of story applies to Vietnam. Our Vietnam war was a political disaster. America was not united -- it was polarized, with antiwar riots on college campuses, "days of rage" on the streets.
But not so for the North Vietnamese. This was total war for them. They were willing to sacrifice everything to win this war. And it didn't end with the Vietnam war: During the 1970s there was a massive civil war in Cambodia that killed millions of people.
So our Vietnam war was a non-crisis war, but it was a crisis war for the Vietnamese. It occurred a little over 80 years after their last crisis war - the French Indochina war of the 1880s and 1890s.
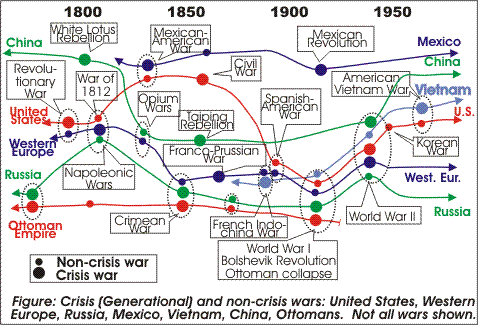
Finally, let's add Western Europe, Russia, and the Ottoman Empire to the graphic:
 |
This graphic shows numerous wars among these countries, and the type of war for each country.
This graphic makes an additional point: Suppose you remove the lines from the graphic, and color all the large and small dots black. Just looking at the dots, you'd see no pattern whatsoever. It's only when you trace the path along each country line do you see each the cyclic pattern for each country.
This illustrates why it's impossible to detect cycles or patterns in wars generally. The patterns arise only on a local basis.
This is the Generational Dynamics Principle of Localization. It says that generational patterns can be found on a local basis, not on a global basis.
&&2 "Forecasts: Next crisis wars for countries"
Generational Dynamics is a forecasting tool as well as an analytical tool. Using an estimate that a new crisis war begins 55 to 75 years after the previous crisis war ends, we can estimate the range of dates when the next crisis war is likely to begin in each of several countries:
| Country | Year ending last crisis war | Likely dates of next crisis war |
|---|---|---|
| Iran | 1921 | 1979-88 Iran/Iraq war - completed |
| Russia | 1928 | 1993-? Early battles in Russia's next crisis war have already begun in Chechnya |
| Mexico | 1924 | 1979-1999 (Overdue) |
| Saudi Arabia | 1932 | 1987-2007 |
| West Europe | 1945 | 2000-2020 |
| United States | 1945 | 2000-2020 |
| Japan | 1945 | 2000-2020 |
| Israel/Palestine | 1949 | 2004-2024 |
| China | 1949 | 2004-2024 |
The above table is too imprecise for most practical purposes. Refining the dates requires going into detail about the specific generational changes that lead from one crisis war to the next.