Dynamics

|
Generational Dynamics |
| Forecasting America's Destiny ... and the World's | |
| HOME WEB LOG COUNTRY WIKI COMMENT FORUM DOWNLOADS ABOUT | |
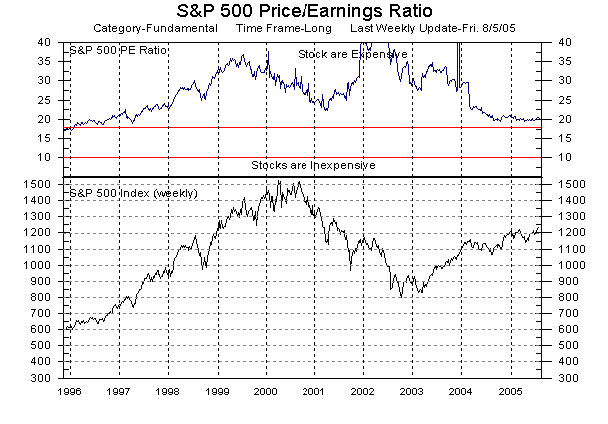
If you look at the bottom of this web site's home page, you'll see a graph, automatically updated every week, of the S&P 500-stock index, and the S&P 500 stock price/earning ratio index.
Here's the graph as of today:
 |
See anything strange?
For the last several months, the P/E ratio has been constant -- around 20. As far as I can tell, going back to the 1800s, the P/E ratio has never before remained constant for several months like that.
In fact, it's been almost constant for a full year, especially when you realize that the Presidential election probably pushed the stock market up slightly, as happens in any election year.
What's the explanation? It could be a coincidence, but I don't believe a coincidence like this could go on for so long.
What it must mean is that most investors are making investment decisions based on a formula, and they're all using the same formula.
And the formula is equivalent to investing in a stock portfolio with an average p/e ratio of about 20.
Does that seem strange to you? Why should it? Do you really think that all those stock analysts think for themselves all the time? They're like everyone else -- they talk to each other, and they all do the same thing.
Actually, I think I know what formula all the stock analysts are using. Several months ago, I read a commentary somewhere that mentioned that most investors were using the "Fed Model" for investments.
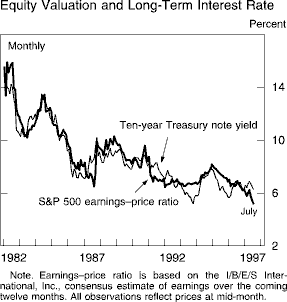
I did some investigation, and it turns out that the "Fed Model" is based on one single paragraph and a graphic buried deep in the middle of a 1997 Federal Reserve report. The graphic and the paragraph are as follows:
 |
So, from what I can gather, a sizable majority of investors today are basing their investment decisions on the "Fed Model," which is based on a single paragraph in a 1997 Fed report. It's laughable, but it's true.
Incidentally, in case you were wondering, the correlation shown in the graphic did not work prior to 1982. However, most financial analysts today are kids in their 20s and 30s, so anything before 1982 is ancient history to them anyway.
This observation that most investors and financial analysts are following the same formula ties in with something else.
In May, I wrote an article about stock market volatility. I pointed out that the stock market was getting increasingly volatile, meaning that the marketing was fluctuating wildly.
In that article, I explained that "the volatility means that individual investors are not making decisions based on individual stocks, which they do in normal times; instead, they're nervously making buy/sell decisions based on their "feeling" about where the entire stock market in going. With investors moving in unison, that means that the entire market is subject to volatility that only a single stock would have in normal times, and it means that a scare can cause a panic and a stock market crash."
When I wrote that paragraph, I didn't know what "feeling" the individual investors were getting. But now with the observation that the P/E ratios are remaining constant, we can infer that this "feeling" is based on a formula that they're all using like sheep, so they're all acting roughly in unison. And that formula is probably something close to the "Fed Model."
For some reason, some people think that stock market panics have been banished. I can't imagine why.
But as we discussed in an article last month, the true value of the stock market is at Dow 4500, and
so the market today is well over 100% overvalued. When a panic
occurs, then the market is liable to fall to the Dow 3000-4000 range.
(11-Aug-05)
Permanent Link
Receive daily World View columns by e-mail
Donate to Generational Dynamics via PayPal
Web Log Summary - 2016
Web Log Summary - 2015
Web Log Summary - 2014
Web Log Summary - 2013
Web Log Summary - 2012
Web Log Summary - 2011
Web Log Summary - 2010
Web Log Summary - 2009
Web Log Summary - 2008
Web Log Summary - 2007
Web Log Summary - 2006
Web Log Summary - 2005
Web Log Summary - 2004
Web Log - December, 2016
Web Log - November, 2016
Web Log - October, 2016
Web Log - September, 2016
Web Log - August, 2016
Web Log - July, 2016
Web Log - June, 2016
Web Log - May, 2016
Web Log - April, 2016
Web Log - March, 2016
Web Log - February, 2016
Web Log - January, 2016
Web Log - December, 2015
Web Log - November, 2015
Web Log - October, 2015
Web Log - September, 2015
Web Log - August, 2015
Web Log - July, 2015
Web Log - June, 2015
Web Log - May, 2015
Web Log - April, 2015
Web Log - March, 2015
Web Log - February, 2015
Web Log - January, 2015
Web Log - December, 2014
Web Log - November, 2014
Web Log - October, 2014
Web Log - September, 2014
Web Log - August, 2014
Web Log - July, 2014
Web Log - June, 2014
Web Log - May, 2014
Web Log - April, 2014
Web Log - March, 2014
Web Log - February, 2014
Web Log - January, 2014
Web Log - December, 2013
Web Log - November, 2013
Web Log - October, 2013
Web Log - September, 2013
Web Log - August, 2013
Web Log - July, 2013
Web Log - June, 2013
Web Log - May, 2013
Web Log - April, 2013
Web Log - March, 2013
Web Log - February, 2013
Web Log - January, 2013
Web Log - December, 2012
Web Log - November, 2012
Web Log - October, 2012
Web Log - September, 2012
Web Log - August, 2012
Web Log - July, 2012
Web Log - June, 2012
Web Log - May, 2012
Web Log - April, 2012
Web Log - March, 2012
Web Log - February, 2012
Web Log - January, 2012
Web Log - December, 2011
Web Log - November, 2011
Web Log - October, 2011
Web Log - September, 2011
Web Log - August, 2011
Web Log - July, 2011
Web Log - June, 2011
Web Log - May, 2011
Web Log - April, 2011
Web Log - March, 2011
Web Log - February, 2011
Web Log - January, 2011
Web Log - December, 2010
Web Log - November, 2010
Web Log - October, 2010
Web Log - September, 2010
Web Log - August, 2010
Web Log - July, 2010
Web Log - June, 2010
Web Log - May, 2010
Web Log - April, 2010
Web Log - March, 2010
Web Log - February, 2010
Web Log - January, 2010
Web Log - December, 2009
Web Log - November, 2009
Web Log - October, 2009
Web Log - September, 2009
Web Log - August, 2009
Web Log - July, 2009
Web Log - June, 2009
Web Log - May, 2009
Web Log - April, 2009
Web Log - March, 2009
Web Log - February, 2009
Web Log - January, 2009
Web Log - December, 2008
Web Log - November, 2008
Web Log - October, 2008
Web Log - September, 2008
Web Log - August, 2008
Web Log - July, 2008
Web Log - June, 2008
Web Log - May, 2008
Web Log - April, 2008
Web Log - March, 2008
Web Log - February, 2008
Web Log - January, 2008
Web Log - December, 2007
Web Log - November, 2007
Web Log - October, 2007
Web Log - September, 2007
Web Log - August, 2007
Web Log - July, 2007
Web Log - June, 2007
Web Log - May, 2007
Web Log - April, 2007
Web Log - March, 2007
Web Log - February, 2007
Web Log - January, 2007
Web Log - December, 2006
Web Log - November, 2006
Web Log - October, 2006
Web Log - September, 2006
Web Log - August, 2006
Web Log - July, 2006
Web Log - June, 2006
Web Log - May, 2006
Web Log - April, 2006
Web Log - March, 2006
Web Log - February, 2006
Web Log - January, 2006
Web Log - December, 2005
Web Log - November, 2005
Web Log - October, 2005
Web Log - September, 2005
Web Log - August, 2005
Web Log - July, 2005
Web Log - June, 2005
Web Log - May, 2005
Web Log - April, 2005
Web Log - March, 2005
Web Log - February, 2005
Web Log - January, 2005
Web Log - December, 2004
Web Log - November, 2004
Web Log - October, 2004
Web Log - September, 2004
Web Log - August, 2004
Web Log - July, 2004
Web Log - June, 2004