Dynamics

|
Generational Dynamics |
| Forecasting America's Destiny ... and the World's | |
| HOME WEB LOG COUNTRY WIKI COMMENT FORUM DOWNLOADS ABOUT | |
Sales volume partially recovered, indicating that you can still sell, if you lower the price enough.
 |
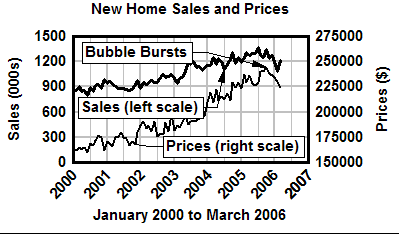
According to a new report by the Census Bureau and Dept. of Commerce (PDF), new home sales rose 13.8% in March, after falling for four months in a row.
Median prices fell 3% in March to $224,200, down 8% from the October peak of $243,900. Total sales have fallen 3% since October.
 |
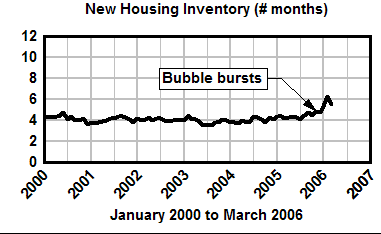
Housing inventories fell slightly to 5.5 months from 6.3 months, but still considerably higher than the typical inventory of around 4 months.
What appears to have happened is that demand built up since the housing bubble burst in October, and now sales are partially recovering because prices have fallen substantially, proving that you can still sell a home if you're willing to lower the price enough.
For existing home sales, March sales rose 0.3%, while prices remained steady.
In Sydney, Australia, the housing prices peaked in 2003, and then started falling, and a recent study describes the effects today -- a big increase in defaults, and a big drop in government services. The economy of the entire state of New South Wales is affected.
Actually, the fall in housing prices has only been modest so far, and the Australian national economy hasn't been hurt too much, thanks to huge Chinese demand for Australian minerals.
In fact, Sydney housing prices have a long way to fall, according to the latest Demographia Inc. International Housing Affordability Survey.
Sydney was still the 7'th least affordable housing market in the survey! This indicates that a housing price crash hasn't really affected Sydney yet, since houses are still way overpriced.
Demographia measures housing markets by computing the "Median Multiple," which equals the Median House Price for the region divided by the Median Household Income for the region. A typical index value is around 3.0, meaning that median house prices equal three times the median household income. (For example, if the median household income is $50,000 and the median house price is $150,000, then the "median multiple" is 3.0.)
The countries surveyed were Australia, Canada, Republic of Ireland, New Zealand, United Kingdom, and the United States.
In those countries, the least affordable housing markets were:
          20 Least affordable housing markets

          Rank  Housing Market                    Median Multiple
          ----  --------------------------------  ---------------
           1      US              Los Angeles             11.2
           2      US              San Diego               10.8
           3      US              Honolulu                10.6
           4      US              Ventura County           9.6
           5      US              San Francisco            9.3
           6      US              Miami                    8.8
           7      Australia       Sydney                   8.5
           8      US              New York                 7.9
           9      US              Riverside                7.7
          10      US              San Jose                 7.4
          11      UK              London                   6.9
          12      UK              Bristol                  6.8
          12      US              Fresno                   6.8
          12      US              Sacramento               6.8
          15      NZ              Auckland                 6.6
          15      Australia       Hobart                   6.6
          15      Canada          Vancouver                6.6
          18      Australia       Adelaide                 6.5
          19      US              Las Vegas                6.4
          19      Australia       Melbourne                6.4
However, there's another side to this survey: there are still many affordable housing markets, and some of the most affordable are in the United States:
          24 most affordable housing markets

          Rank  Housing Market                    Median Multiple
          ----  --------------------------------  ---------------
           1      US              Buffalo                  2.2
           1      US              Rochester                2.2
           3      US              Indianapolis             2.4
           3      Canada          Winnipeg                 2.4
           5      US              Akron                    2.5
           5      US              Omaha                    2.5
           5      US              Pittsburgh               2.5
           8      US              Grand Rapids             2.6
           8      US              St. Louis                2.6
           8      US              Tulsa                    2.6
          11      US              Dayton                   2.7
          11      US              Kansas City              2.7
          11      US              Oklahoma City            2.7
          14      US              Atlanta                  2.8
          14      US              Austin                   2.8
          14      US              Cincinnati               2.8
          14      US              Dallas-Fort Worth        2.8
          14      Canada          Edmonton                 2.8
          14      US              Louisville               2.8
          14      Canada          Quebec                   2.8
          21      US              Columbus                 2.9
          21      US              Houston                  2.9
          21      US              San Antonio              2.9
          24      US              Cleveland                3.0
These results show that there are still housing markets that aren't
overpriced. But once a major financial crisis occurs, everyone wil
suffer.
(28-Apr-06)
Permanent Link
Receive daily World View columns by e-mail
Donate to Generational Dynamics via PayPal
Web Log Summary - 2016
Web Log Summary - 2015
Web Log Summary - 2014
Web Log Summary - 2013
Web Log Summary - 2012
Web Log Summary - 2011
Web Log Summary - 2010
Web Log Summary - 2009
Web Log Summary - 2008
Web Log Summary - 2007
Web Log Summary - 2006
Web Log Summary - 2005
Web Log Summary - 2004
Web Log - December, 2016
Web Log - November, 2016
Web Log - October, 2016
Web Log - September, 2016
Web Log - August, 2016
Web Log - July, 2016
Web Log - June, 2016
Web Log - May, 2016
Web Log - April, 2016
Web Log - March, 2016
Web Log - February, 2016
Web Log - January, 2016
Web Log - December, 2015
Web Log - November, 2015
Web Log - October, 2015
Web Log - September, 2015
Web Log - August, 2015
Web Log - July, 2015
Web Log - June, 2015
Web Log - May, 2015
Web Log - April, 2015
Web Log - March, 2015
Web Log - February, 2015
Web Log - January, 2015
Web Log - December, 2014
Web Log - November, 2014
Web Log - October, 2014
Web Log - September, 2014
Web Log - August, 2014
Web Log - July, 2014
Web Log - June, 2014
Web Log - May, 2014
Web Log - April, 2014
Web Log - March, 2014
Web Log - February, 2014
Web Log - January, 2014
Web Log - December, 2013
Web Log - November, 2013
Web Log - October, 2013
Web Log - September, 2013
Web Log - August, 2013
Web Log - July, 2013
Web Log - June, 2013
Web Log - May, 2013
Web Log - April, 2013
Web Log - March, 2013
Web Log - February, 2013
Web Log - January, 2013
Web Log - December, 2012
Web Log - November, 2012
Web Log - October, 2012
Web Log - September, 2012
Web Log - August, 2012
Web Log - July, 2012
Web Log - June, 2012
Web Log - May, 2012
Web Log - April, 2012
Web Log - March, 2012
Web Log - February, 2012
Web Log - January, 2012
Web Log - December, 2011
Web Log - November, 2011
Web Log - October, 2011
Web Log - September, 2011
Web Log - August, 2011
Web Log - July, 2011
Web Log - June, 2011
Web Log - May, 2011
Web Log - April, 2011
Web Log - March, 2011
Web Log - February, 2011
Web Log - January, 2011
Web Log - December, 2010
Web Log - November, 2010
Web Log - October, 2010
Web Log - September, 2010
Web Log - August, 2010
Web Log - July, 2010
Web Log - June, 2010
Web Log - May, 2010
Web Log - April, 2010
Web Log - March, 2010
Web Log - February, 2010
Web Log - January, 2010
Web Log - December, 2009
Web Log - November, 2009
Web Log - October, 2009
Web Log - September, 2009
Web Log - August, 2009
Web Log - July, 2009
Web Log - June, 2009
Web Log - May, 2009
Web Log - April, 2009
Web Log - March, 2009
Web Log - February, 2009
Web Log - January, 2009
Web Log - December, 2008
Web Log - November, 2008
Web Log - October, 2008
Web Log - September, 2008
Web Log - August, 2008
Web Log - July, 2008
Web Log - June, 2008
Web Log - May, 2008
Web Log - April, 2008
Web Log - March, 2008
Web Log - February, 2008
Web Log - January, 2008
Web Log - December, 2007
Web Log - November, 2007
Web Log - October, 2007
Web Log - September, 2007
Web Log - August, 2007
Web Log - July, 2007
Web Log - June, 2007
Web Log - May, 2007
Web Log - April, 2007
Web Log - March, 2007
Web Log - February, 2007
Web Log - January, 2007
Web Log - December, 2006
Web Log - November, 2006
Web Log - October, 2006
Web Log - September, 2006
Web Log - August, 2006
Web Log - July, 2006
Web Log - June, 2006
Web Log - May, 2006
Web Log - April, 2006
Web Log - March, 2006
Web Log - February, 2006
Web Log - January, 2006
Web Log - December, 2005
Web Log - November, 2005
Web Log - October, 2005
Web Log - September, 2005
Web Log - August, 2005
Web Log - July, 2005
Web Log - June, 2005
Web Log - May, 2005
Web Log - April, 2005
Web Log - March, 2005
Web Log - February, 2005
Web Log - January, 2005
Web Log - December, 2004
Web Log - November, 2004
Web Log - October, 2004
Web Log - September, 2004
Web Log - August, 2004
Web Log - July, 2004
Web Log - June, 2004