Dynamics

|
Generational Dynamics |
| Forecasting America's Destiny ... and the World's | |
| HOME WEB LOG COUNTRY WIKI COMMENT FORUM DOWNLOADS ABOUT | |
This is an extraordinary and historic event in economic journalism.
A web site reader called my attention to an article in the NY Times that discusses the danger to the stock market illustrated by historic price/earnings ratios.
I've been discussing price/earnings ratios on this web site, most recently in my recent analysis, "How to compute the 'real value' of the stock market."
But to see it in mainstream media is incredibly startling, since "experts" and pundits and Fed governors, and professors of economics and everyone else have been completely oblivious to historical data. Most of them believe that the world was created 15 or 20 years ago, and nothing before that date mattered.
(As an aside, the web site Wall Street Journal online has started making "historical data" available. "Oh!" I thought, "That should be useful!" Well, if you try to get any of their historical data, it goes back a WHOLE THREE MONTHS! Greg Ip and the other dodos at the Journal are even worse than other journalists - and apparently believe that the world was created just three months ago.)
In the NY Times article, I find these amazing paragraphs:
Their classic 1934 textbook, “Security Analysis,” became the bible for what is now known as value investing. Warren E. Buffett took Mr. Graham’s course at Columbia Business School in the 1950s and, after working briefly for Mr. Graham’s investment firm, set out on his own to put the theories into practice. Mr. Buffett’s billions are just one part of the professors’ giant legacy.
Yet somehow, one of their big ideas about how to analyze stock prices has been almost entirely forgotten. The idea essentially reminds investors to focus on long-term trends and not to get caught up in the moment. Unfortunately, when you apply it to today’s stock market, you get even more nervous about what’s going on.
Most Wall Street analysts, of course, say there is nothing to be worried about, at least not beyond the mortgage market. In an effort to calm investors after the recent volatility, analysts have been arguing that stocks are not very expensive right now. The basis for this argument is the standard measure of the market: the price-to-earnings ratio.
The article uses a different measure of price/earnings, and makes a couple of errors, so I'd like to discuss some of the points of the article.
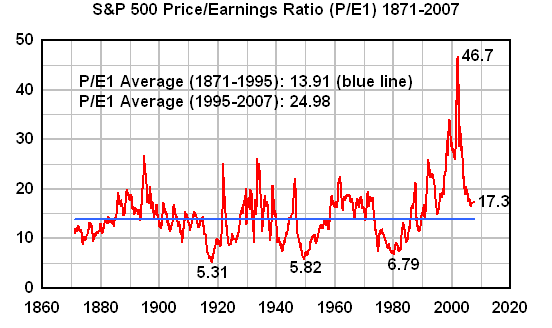
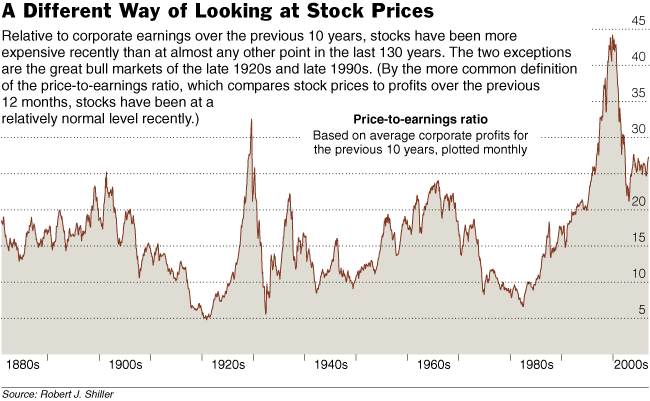
Let's begin by displaying the graph that I used in my recent article, followed by the graph in the NY Times article:
 |
 |
The two graphs look almost the same, but there are slight differences because "earnings" are computed slightly differently.
The caption on the lower diagram tells the story:
"Relative to corporate earnings over the previous 10 years, stocks have been more expensive recently than at almost any other point in the last 130 years. The two exceptions are the great bull markets of the late 1920s and late 1990s. (By the more common definition of the price-to-earnings ratio, which compares stock prices to profits over the previous 12 months, stocks have been at a relatively normal level recently.)
Price-to-earnings ratio Based on average corporate profits for the previous 10 years, plotted monthly."
When you're computing the price/earnings ratio, it's easy enough to compute the "price" -- it's the current price of a stock share. But how do you compute "earnings"? The most common method is to compute the earnings per share for the preceding year; this measure of price/earnings is called P/E1. But Professor Robert J. Shiller recommends using average annual earnings for the previous ten years. This measure of price/earnings is called P/E10.
Notice that the caption above says that by the P/E1 measure, "stocks have been at a relatively normal level recently."
This is completely wrong, and it illustrates the kinds of misleading statements that are frequently made about P/E ratios.
Please note the following:
However, the biggest error of all in the article is an error of omission: It doesn't mention the Law of Mean Reversion.
The point is that 17 (or 14) is the long-term historical AVERAGE, not the MINIMUM. So if the P/E ratio has been above average since for the last 12 years (since 1995), then it has to be below average for the next 12 years, to make the long-term average the same. I explained all this in my recent analysis.
The biggest mistake in the NY Times article is the conclusion that it draws: "Now, this one statistic does not mean that a bear market is inevitable. But it does offer a good framework for thinking about stocks."
Yes, it means that and a lot more. There's no question about it.
The NY Times article is welcome despite its errors, because it brings greater attention to these issues. It's interesting that the book that it refers to was published in 1934, just after the Wall Street crash. That's the only time when people are interested in such material -- they want to know what went wrong. The generations born later not only know nothing about P/E ratios, but don't want to know.
Within a year or two, P/E ratios will come back into fashion once more, as people try to figure out where they went wrong.
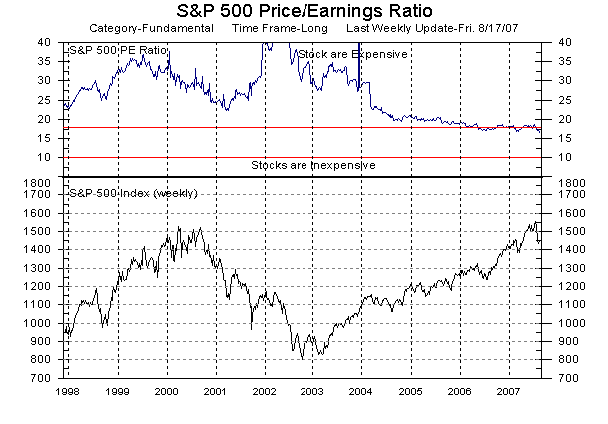
Before closing, let me call the reader's attention to the graph on the bottom of the home page of this web site, there's a graph that changes weekly showing the S&P 500 price/earnings index for the last ten years. Here's the chart as of August 17:
 |
The top part of this graph shows the S&P 500 Price/Earnings ratio. Notice that the graph has been in the "stocks are expensive" region since 1995 until recently. By the Law of Mean Reversion, it will be necessary for stocks to become "inexpensive" for a similar length of time.
I've been posting this graph on my home page for almost five years.
The fact that DataView LLC is providing this graph, and labeling the
"expensive" and "inexpensive" regions, means that there are some
people out there besides myself who know what's going on.
(23-Aug-07)
Permanent Link
Receive daily World View columns by e-mail
Donate to Generational Dynamics via PayPal
Web Log Summary - 2016
Web Log Summary - 2015
Web Log Summary - 2014
Web Log Summary - 2013
Web Log Summary - 2012
Web Log Summary - 2011
Web Log Summary - 2010
Web Log Summary - 2009
Web Log Summary - 2008
Web Log Summary - 2007
Web Log Summary - 2006
Web Log Summary - 2005
Web Log Summary - 2004
Web Log - December, 2016
Web Log - November, 2016
Web Log - October, 2016
Web Log - September, 2016
Web Log - August, 2016
Web Log - July, 2016
Web Log - June, 2016
Web Log - May, 2016
Web Log - April, 2016
Web Log - March, 2016
Web Log - February, 2016
Web Log - January, 2016
Web Log - December, 2015
Web Log - November, 2015
Web Log - October, 2015
Web Log - September, 2015
Web Log - August, 2015
Web Log - July, 2015
Web Log - June, 2015
Web Log - May, 2015
Web Log - April, 2015
Web Log - March, 2015
Web Log - February, 2015
Web Log - January, 2015
Web Log - December, 2014
Web Log - November, 2014
Web Log - October, 2014
Web Log - September, 2014
Web Log - August, 2014
Web Log - July, 2014
Web Log - June, 2014
Web Log - May, 2014
Web Log - April, 2014
Web Log - March, 2014
Web Log - February, 2014
Web Log - January, 2014
Web Log - December, 2013
Web Log - November, 2013
Web Log - October, 2013
Web Log - September, 2013
Web Log - August, 2013
Web Log - July, 2013
Web Log - June, 2013
Web Log - May, 2013
Web Log - April, 2013
Web Log - March, 2013
Web Log - February, 2013
Web Log - January, 2013
Web Log - December, 2012
Web Log - November, 2012
Web Log - October, 2012
Web Log - September, 2012
Web Log - August, 2012
Web Log - July, 2012
Web Log - June, 2012
Web Log - May, 2012
Web Log - April, 2012
Web Log - March, 2012
Web Log - February, 2012
Web Log - January, 2012
Web Log - December, 2011
Web Log - November, 2011
Web Log - October, 2011
Web Log - September, 2011
Web Log - August, 2011
Web Log - July, 2011
Web Log - June, 2011
Web Log - May, 2011
Web Log - April, 2011
Web Log - March, 2011
Web Log - February, 2011
Web Log - January, 2011
Web Log - December, 2010
Web Log - November, 2010
Web Log - October, 2010
Web Log - September, 2010
Web Log - August, 2010
Web Log - July, 2010
Web Log - June, 2010
Web Log - May, 2010
Web Log - April, 2010
Web Log - March, 2010
Web Log - February, 2010
Web Log - January, 2010
Web Log - December, 2009
Web Log - November, 2009
Web Log - October, 2009
Web Log - September, 2009
Web Log - August, 2009
Web Log - July, 2009
Web Log - June, 2009
Web Log - May, 2009
Web Log - April, 2009
Web Log - March, 2009
Web Log - February, 2009
Web Log - January, 2009
Web Log - December, 2008
Web Log - November, 2008
Web Log - October, 2008
Web Log - September, 2008
Web Log - August, 2008
Web Log - July, 2008
Web Log - June, 2008
Web Log - May, 2008
Web Log - April, 2008
Web Log - March, 2008
Web Log - February, 2008
Web Log - January, 2008
Web Log - December, 2007
Web Log - November, 2007
Web Log - October, 2007
Web Log - September, 2007
Web Log - August, 2007
Web Log - July, 2007
Web Log - June, 2007
Web Log - May, 2007
Web Log - April, 2007
Web Log - March, 2007
Web Log - February, 2007
Web Log - January, 2007
Web Log - December, 2006
Web Log - November, 2006
Web Log - October, 2006
Web Log - September, 2006
Web Log - August, 2006
Web Log - July, 2006
Web Log - June, 2006
Web Log - May, 2006
Web Log - April, 2006
Web Log - March, 2006
Web Log - February, 2006
Web Log - January, 2006
Web Log - December, 2005
Web Log - November, 2005
Web Log - October, 2005
Web Log - September, 2005
Web Log - August, 2005
Web Log - July, 2005
Web Log - June, 2005
Web Log - May, 2005
Web Log - April, 2005
Web Log - March, 2005
Web Log - February, 2005
Web Log - January, 2005
Web Log - December, 2004
Web Log - November, 2004
Web Log - October, 2004
Web Log - September, 2004
Web Log - August, 2004
Web Log - July, 2004
Web Log - June, 2004