Dynamics

|
Generational Dynamics |
| Forecasting America's Destiny ... and the World's | |
| HOME WEB LOG COUNTRY WIKI COMMENT FORUM DOWNLOADS ABOUT | |
Second quarter earnings were disastrous.
As regular readers know, I post the table of S&P 500 average corporate earnings estimates, based on figures from CNBC Earnings Central supplied by Thomson Reuters.
Here's the final table for second quarter earnings:
  Date    2Q Earnings growth estimate as of that date
  ------- -------------------------------------------
  Jan  1:              +4.7%
  Feb  6:              +3.5%
  Apr  1:              -2.0%   Start of quarter
  Jun  6:              -7.3%
  Jun 13:              -8.1%
  Jun 20:              -9.0%
  Jun 27:             -11.3%   End of quarter
  Jul  3:             -12.4%
  Jul  8:             -13.0%
  Jul 11:             -14.7%
  Jul 18:             -17.1%
  Jul 25:             -17.9%
  Aug  1:             -20.4%
  Aug  8:             -22.1%
  Aug 15:             -22.0%
You can see that, as the second quarter earnings season ends, and actual earnings are available, earnings are 22% lower than they were last year. We should start to have third quarter earnings estimates next week.
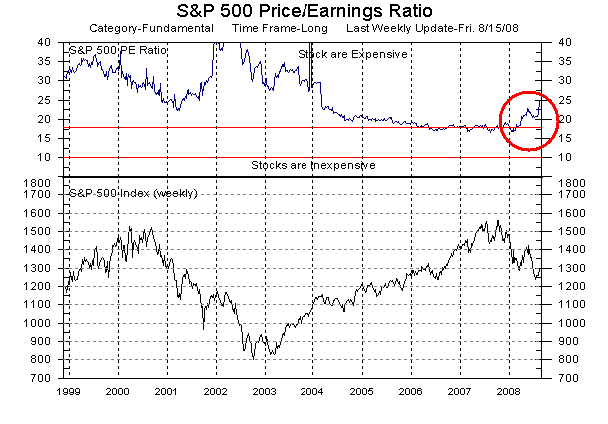
A fall in earnings estimates means an increase of price/earnings ratios estimates. Here's the Friday's version of the graphic that appears on the bottom of the home page of this web site:
 |
As you can see, P/E ratios (also called "valuations") have returned to really astronomical heights.
We're now "celebrating" the one-year anniversary of the worldwide global credit crisis.
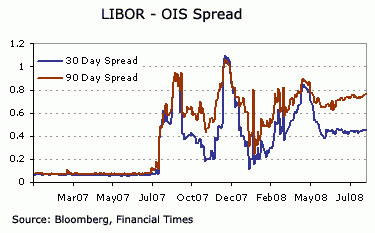
As a measure of that celebration, here's an interesting graph from a blog at the Federal Reserve Bank of Atlanta:
 |
LIBOR is the London InterBank Offered rate. It represents the interest rates that banks charge one another for 30 or 90 day loans.
The OIS is the Overnight Index Swap rate, and it represents the interest rates that banks charge each other for overnight loans.
The difference (or "spread") between LIBOR and OIS measures the willingness of banks to loan money to one another for more than overnight. If I don't trust you, then I might still risk loaning you money overnight, but for any longer period I'd charge a much higher interest rate. The size of that interest rate is a measure of my distrust.
Prior to August, 2007, the Libor-OIS spread was pretty much flat at 6 basis points (or a 0.06% interest rate difference). With the credit crunch, the spread skyrocketed, reaching 110 basis points (1.10% interest rate difference) on December 4. Now it's still much higher than historical rates, meaning that the credit crunch is far from over.
That shouldn't be surprising, because continually have to write down more and more worthless assets. According to one analysis:
The writedowns and credit losses at more than 100 of the world's biggest banks and securities firms rose after UBS AG reported second-quarter earnings [on August 12], which included $6 billion of charges on subprime-related assets."
The following table shows the asset writedowns and credit losses as well as the capital raised in response. All numbers are in billions of U.S. dollars. Check out your favorite bank:
        Firm               Writedown & Loss      Capital Raised
        Citigroup                 55.1               49.1
        Merrill Lynch             51.8               29.9
        UBS                       44.2               28.3
        HSBC                      27.4                3.9
        Wachovia                  22.5               11
        Bank of America           21.2               20.7
        IKB Deutsche              15.3               12.6
        Royal Bank of Scotland    14.9               24.3
        Washington Mutual         14.8               12.1
        Morgan Stanley            14.4                5.6
        JPMorgan Chase            14.3                7.9
        Deutsche Bank             10.8                3.2
        Credit Suisse             10.5                2.7
        Wells Fargo               10                  4.1
        Barclays                   9.1               18.6
        Lehman Brothers            8.2               13.9
        Credit Agricole            8                  8.8
        Fortis                     7.4                7.2
        HBOS                       7.1                7.6
        Societe Generale           6.8                9.8
        Bayerische Landesbank      6.4                -
        Canadian Imperial (CIBC)   6.3                2.8
        Mizuho Financial Group     5.9                  -
        ING Groep                  5.8                4.8
        National City              5.4                8.9
        Lloyds TSB                 5                  4.9
        IndyMac                    4.9                -
        WestLB                     4.7                7.5
        Dresdner                   4.1                -
        BNP Paribas                4                  -
        LB Baden-Wuerttemberg      3.8                -
        Goldman Sachs              3.8                0.6
        E*Trade                    3.6                2.4
        Nomura Holdings            3.3                1.1
        Natixis                    3.3                6.7
        Bear Stearns               3.2                -
        HSH Nordbank               2.8                1.9
        Landesbank Sachsen         2.6                -
        UniCredit                  2.6                -
        Commerzbank                2.4                -
        ABN Amro                   2.3                -
        DZ Bank                    2                  -
        Bank of China              2                  -
        Fifth Third                1.9                2.6
        Rabobank                   1.7                -
        Bank Hapoalim              1.7                2.4
        Mitsubishi UFJ             1.6                1.5
        Royal Bank of Canada       1.5                -
        Marshall & Ilsley          1.4                -
        Alliance & Leicester       1.4                -
        U.S. Bancorp               1.3                -
        Dexia                      1.2                -
        Caisse d'Epargne           1.2                -
        Keycorp                    1.2                1.7
        Sovereign Bancorp          1                  1.9
        Hypo Real Estate           1                  -
        Gulf International         1                  1
        Sumitomo Mitsui            0.9                4.9
        Sumitomo Trust             0.7                1
        DBS Group                  0.2                1.1
        Other European banks       7.2                2.3
        Other Asian banks          4.6                7.8
        Other U.S. banks           2.9                1.9
        Other Canadian banks       1.8                -
                                   ____              ____
        TOTAL                    501.1              352.9
As one online correspondent wrote, "I would compare the current economy to a house of cards. Cards are being yanked out from the bottom-it won't be much longer before the whole thing collapses."
I've estimated that the probability of a major financial crisis (generational stock market panic and
crash) in any given week from now on is about 3%. The probability of
a crisis some time in the next 52 weeks is 75%, according to this
estimate.
(19-Aug-2008)
Permanent Link
Receive daily World View columns by e-mail
Donate to Generational Dynamics via PayPal
Web Log Summary - 2016
Web Log Summary - 2015
Web Log Summary - 2014
Web Log Summary - 2013
Web Log Summary - 2012
Web Log Summary - 2011
Web Log Summary - 2010
Web Log Summary - 2009
Web Log Summary - 2008
Web Log Summary - 2007
Web Log Summary - 2006
Web Log Summary - 2005
Web Log Summary - 2004
Web Log - December, 2016
Web Log - November, 2016
Web Log - October, 2016
Web Log - September, 2016
Web Log - August, 2016
Web Log - July, 2016
Web Log - June, 2016
Web Log - May, 2016
Web Log - April, 2016
Web Log - March, 2016
Web Log - February, 2016
Web Log - January, 2016
Web Log - December, 2015
Web Log - November, 2015
Web Log - October, 2015
Web Log - September, 2015
Web Log - August, 2015
Web Log - July, 2015
Web Log - June, 2015
Web Log - May, 2015
Web Log - April, 2015
Web Log - March, 2015
Web Log - February, 2015
Web Log - January, 2015
Web Log - December, 2014
Web Log - November, 2014
Web Log - October, 2014
Web Log - September, 2014
Web Log - August, 2014
Web Log - July, 2014
Web Log - June, 2014
Web Log - May, 2014
Web Log - April, 2014
Web Log - March, 2014
Web Log - February, 2014
Web Log - January, 2014
Web Log - December, 2013
Web Log - November, 2013
Web Log - October, 2013
Web Log - September, 2013
Web Log - August, 2013
Web Log - July, 2013
Web Log - June, 2013
Web Log - May, 2013
Web Log - April, 2013
Web Log - March, 2013
Web Log - February, 2013
Web Log - January, 2013
Web Log - December, 2012
Web Log - November, 2012
Web Log - October, 2012
Web Log - September, 2012
Web Log - August, 2012
Web Log - July, 2012
Web Log - June, 2012
Web Log - May, 2012
Web Log - April, 2012
Web Log - March, 2012
Web Log - February, 2012
Web Log - January, 2012
Web Log - December, 2011
Web Log - November, 2011
Web Log - October, 2011
Web Log - September, 2011
Web Log - August, 2011
Web Log - July, 2011
Web Log - June, 2011
Web Log - May, 2011
Web Log - April, 2011
Web Log - March, 2011
Web Log - February, 2011
Web Log - January, 2011
Web Log - December, 2010
Web Log - November, 2010
Web Log - October, 2010
Web Log - September, 2010
Web Log - August, 2010
Web Log - July, 2010
Web Log - June, 2010
Web Log - May, 2010
Web Log - April, 2010
Web Log - March, 2010
Web Log - February, 2010
Web Log - January, 2010
Web Log - December, 2009
Web Log - November, 2009
Web Log - October, 2009
Web Log - September, 2009
Web Log - August, 2009
Web Log - July, 2009
Web Log - June, 2009
Web Log - May, 2009
Web Log - April, 2009
Web Log - March, 2009
Web Log - February, 2009
Web Log - January, 2009
Web Log - December, 2008
Web Log - November, 2008
Web Log - October, 2008
Web Log - September, 2008
Web Log - August, 2008
Web Log - July, 2008
Web Log - June, 2008
Web Log - May, 2008
Web Log - April, 2008
Web Log - March, 2008
Web Log - February, 2008
Web Log - January, 2008
Web Log - December, 2007
Web Log - November, 2007
Web Log - October, 2007
Web Log - September, 2007
Web Log - August, 2007
Web Log - July, 2007
Web Log - June, 2007
Web Log - May, 2007
Web Log - April, 2007
Web Log - March, 2007
Web Log - February, 2007
Web Log - January, 2007
Web Log - December, 2006
Web Log - November, 2006
Web Log - October, 2006
Web Log - September, 2006
Web Log - August, 2006
Web Log - July, 2006
Web Log - June, 2006
Web Log - May, 2006
Web Log - April, 2006
Web Log - March, 2006
Web Log - February, 2006
Web Log - January, 2006
Web Log - December, 2005
Web Log - November, 2005
Web Log - October, 2005
Web Log - September, 2005
Web Log - August, 2005
Web Log - July, 2005
Web Log - June, 2005
Web Log - May, 2005
Web Log - April, 2005
Web Log - March, 2005
Web Log - February, 2005
Web Log - January, 2005
Web Log - December, 2004
Web Log - November, 2004
Web Log - October, 2004
Web Log - September, 2004
Web Log - August, 2004
Web Log - July, 2004
Web Log - June, 2004