Ah I now see where you have been going. First of all the economy did not slump after the 1987 crash, no more than it did in 1998. The dates you note: 1819, 1837, 1957, 1873, 1893 are the panic dates. Two are missing, 1907 and 1929. So you see 1907 is just another one of the recurring panics that are spaced 18 years apart. This 18 year cycle is related to a cycle in land values, speculation and construction activity. I talk about it in a two part article back in 2002.Originally Posted by Devil's Advocate
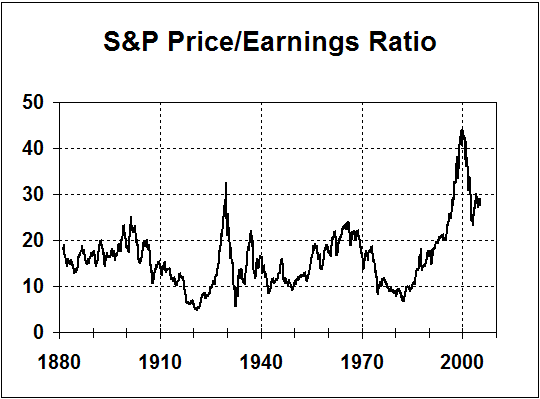
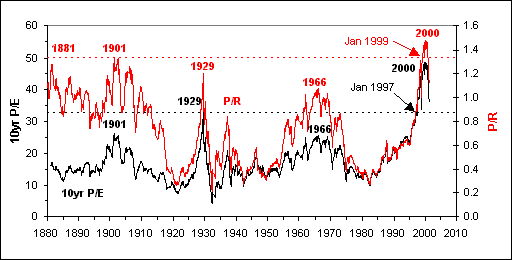
I explicitly relate it to S&H turnings in my third and fourth books. I also relate them to the Schlesinger cycle. When you point out that we don't see the panic dates anymore you are partially right. Because of government economic management, panics are a thing of the past. We don't see big economic fluctuations anymore. If you plot GDP relative to trend you will see how the oscillations damped way down after WW II. On the other hand, stock market oscillations have greatly increased in recent decades. Since 1920 the secular market trends have become very pronounced, and since 1929 have averaged 18 years in duration. In fact what has happened is one set of important financial dates the Panics in 1819 1837 1857 1873 1892 1907 and the Crash of 1929 has been replaced by another set of important financial dates, the secular trend turning points: 1929 1949 1966 1982 2000
I identified one of these turning points in real time in my first book subtitled "why stocks won't beat money markets for twenty years". It's been five years since I wrote that book and so far my prediction is dead on. Stock returns since 2000 have sucked just as land speculation sucked after every one of those 19th century panic dates.
Its when you put together the two important financial dates and look at it with "saecular" eyes that you can see something:
1819 1837 1857 1873 1893 1907 1929 1949 1966 1982 2000
1822 1844 1860 1865 1886 1908 1929 1946 1964 1984 ????
And then you can look at the Schlesinger cycle dates:
1828 1840 1860 1872 1901 1919 1931 1946 1961 1980 ????
1819 1837 1857 1873 1893 1907 1929 1949 1966 1982 2000
1822 1844 1860 1865 1886 1908 1929 1946 1964 1984 ????
As I said before the Schlesinger cycle is pretty variable in length, but as S&H noted it seems to keep pace with the saeculum. This tendency for the cycle keep pace can explain why Schlesinger was wrong about 1992. He considers the super long conservative era in the late 19th century as an anomaly. So he thinks that both kinds of eras are roughly 15-16 years long. His father noted the 1946 election as a liberal--> conservative shift and forecasted the reverse shift in 1962 and back the other way in 1978. These dates were pretty good. If you add 15 years onto 1978 you should look for the shift back from Reaganism in about 1993. Can you see why Schlesinger believed liberalism was back when Clinton won in 1992?
If you use the 18 year timing you would note that a pair of eras (the actual cycle) runs 36 years on average. If we start with the conservative to liberal shift in 1860 we would look for the next shift in the same direction in 1896. It happened in 1901, five years later. The next shift should happen in 1932, which it pretty much did. The next one should happen in 1968. It happening seven years early. The next one should occur around 2004, but could run anywhere from 7 years early to 5 years late or 1997-2009. This analysis shows that expecting a conservative to liberal swing in 1992 was way too early. Such a shift could happen now and it could happen in 2008 or even after and not be greatly out of line with past variations.
- Join Date
- Jul 2001
- Location
- Kalamazoo MI
- Posts
- 4,501


 :wink: