Generational Dynamics
Fourth Turning Forum Archive


Popular links:
Generational Dynamics Web Site
Generational Dynamics Forum
Fourth Turning Archive home page
New Fourth Turning Forum

Thread: Objections to Generational Dynamics - Page 98


Post#2426 at 08-16-2007 05:02 PM by 1990 [at Savannah, GA joined Sep 2006 #posts 1,450]
---
08-16-2007, 05:02 PM #2426
Join Date
Sep 2006
Location
Savannah, GA
Posts
1,450

John, could you update your 1929 vs. 2007 Dow comparison chart (posted August 10) to include numbers since the 10th? It was very interesting and you should keep it updated daily if possible to see if the trend is following 1929's slow hemorrhaging.
My Turning-based Map of the World

Thanks, John Xenakis, for hosting my map

Myers-Briggs Type: INFJ


Post#2427 at 08-16-2007 09:31 PM by catfishncod [at The People's Republic of Cambridge & Possum Town, MS joined Apr 2005 #posts 984]
---
08-16-2007, 09:31 PM #2427
Join Date
Apr 2005
Location
The People's Republic of Cambridge & Possum Town, MS
Posts
984

Quote Originally Posted by MichaelEaston View Post
Hey, I thought it was pretty climactic. It's not every day that you see a 330 point drop recover in a matter of hours.
Ha! Hours? Try MINUTES. At 3:12 pm, the Dow was at 12,564 (down 297 points). At 3:56 pm, it stood at 12,872.12 (up 11). That's a 308 point change in forty-four minutes flat.

That scares me MORE than a 300-point session itself does. Furthermore, no one can tie it to any economic news; it is as if the Deity grabbed the Invisible Hand by the wrist and guided it. It means absolutely no one really knows what the value of the Dow is. How can you make a trade when the price can be wildly different in the next hour?

I highly suspect that the rally was caused by some automated system. There are bars on automatic trading when the Dow falls precipitously, but not when it rises precipitously. That may be an error in programming...

The Asian markets will open in a few hours. What will they make of that bizarre rally?
'81, 30/70 X/Millie, trying to live in both Red and Blue America... "Catfish 'n Cod"


Post#2428 at 08-16-2007 10:04 PM by Odin [at Moorhead, MN, USA joined Sep 2006 #posts 14,442]
---
08-16-2007, 10:04 PM #2428
Join Date
Sep 2006
Location
Moorhead, MN, USA
Posts
14,442

Quote Originally Posted by 1990 View Post
I don't think it's yet fair to dub this the New Depression, but it definitely has the potential. The thing is, in recent years we have had one-day nosedives (after 9/11 and again on February 27 of this year) that were mere corrections. I'm hesitant to yet call for the long-due stock market crash. But if this is it, then the Dow is merely lagging behind the real estate market in indicators. The housing bust started in late '05, early '06.
This is not some "mere" correction in any case, though I agree that it's too early too assume that the next Great Depression is upon us.
To recommend thrift to the poor is both grotesque and insulting. It is like advising a man who is starving to eat less.

-Oscar Wilde, The Soul of Man under Socialism


Post#2429 at 08-16-2007 10:04 PM by Odin [at Moorhead, MN, USA joined Sep 2006 #posts 14,442]
---
08-16-2007, 10:04 PM #2429
Join Date
Sep 2006
Location
Moorhead, MN, USA
Posts
14,442

Quote Originally Posted by 1990 View Post
John, could you update your 1929 vs. 2007 Dow comparison chart (posted August 10) to include numbers since the 10th? It was very interesting and you should keep it updated daily if possible to see if the trend is following 1929's slow hemorrhaging.
ditto.

.....
To recommend thrift to the poor is both grotesque and insulting. It is like advising a man who is starving to eat less.

-Oscar Wilde, The Soul of Man under Socialism


Post#2430 at 08-16-2007 10:07 PM by John J. Xenakis [at Cambridge, MA joined May 2003 #posts 4,010]
---
08-16-2007, 10:07 PM #2430
Join Date
May 2003
Location
Cambridge, MA
Posts
4,010

Dear Nathaniel,

Quote Originally Posted by 1990 View Post
> I don't think it's yet fair to dub this the New Depression, but it
> definitely has the potential. The thing is, in recent years we
> have had one-day nosedives (after 9/11 and again on February 27 of
> this year) that were mere corrections. I'm hesitant to yet call
> for the long-due stock market crash. But if this is it, then the
> Dow is merely lagging behind the real estate market in indicators.
> The housing bust started in late '05, early '06.
That isn't the reason. A stock market nosedive happens all the time.
As with everything else in generational theory, it's not the "spark"
that matters, but people's reactions to the spark.
  • The reactions have been dramatic. I made up my mind that
    generational panic had begun this afternoon, because of the total
    panic in the faces and voices of everyone who was speaking on CNBC.
    They were babbling total nonsense, and it was obvious (as it had been
    for months) they had NO IDEA what was going on.

    It seems like years now, but it was just a month ago that bad
    economic news would push the market to a new high. That was totally
    irrational.

    ** Wall Street stocks hit fresh record highs again
    - All it took was some more bad economic news.
    http://www.generationaldynamics.com/cgi-bin/D.PL?xct=gd.e070714#e070714


    It was just a week ago that I first felt I was sensing the "smell of
    panic."
    ** US and European central banks inject billions in cash to stanch market meltdown
    http://www.generationaldynamics.com/cgi-bin/D.PL?xct=gd.e070810#e070810


    That smell of panic has been growing every day since then, and today
    it was a stench. Every little bit of bad news is enough to cause the
    Dow to fall 100 points almost immediately. And they're all baffled
    by it and desperate. This, it seems to me, is precisely what
    generational panic is.

    As if to prove my point, the market gained about 200 points in the
    last few minutes of the session (not HOURS, Matt, but MINUTES). When
    the Dow went positive, there was a huge cheer from everyone on the
    floor of the stock exchange, as if a soccer team had scored a goal,
    and if I'm not mistaken, Maria Bartoloma was so giddy that she jumped
    up and down like a schoolgirl.

    So you have a situation where literally no one has any idea at all
    what's going on. NO IDEA AT ALL.
  • The panic is fully justified. Most investors are oblivious to
    the CDO (collateralized debt obligation) problem, but this is a huge
    problem as I've previously posted, and the worst-case scenario is
    panning out as the truth. Think of the world economy as a huge,
    enormous bloated mansion made of wood, with all kinds of additions
    tacked on all over the place. Think of the CDOs as millions of
    termites that are eating away at the insides, so that another piece
    of the mansion falls off into the ravine almost every day, and it
    won't be long before the entire house falls into the ravine.

    I have to tell you, I've been following this thing with CDOs closely,
    and it is BEYOND BELIEF what's happened.
  • Everything happening now is what happened just before the 1929
    crash, as describe in John Kenneth Galbraith's 1954 book, <i>The Great
    Crash - 1929,</i> which I've quoted many times on my web site: The
    mania for mergers and acquisitions, the drying up of liquidity, the
    central banks injecting funds to stave off disaster. They even had
    hedge funds in those days -- only, they were called "investment
    trusts," and they were just as abused as hedge funds are
    today.


There have been HUGE changes in attitudes and behaviors in just the
last couple of weeks, and that's why I'm saying that the nightmare
has begun.

Quote Originally Posted by 1990 View Post
> John, could you update your 1929 vs. 2007 Dow comparison chart
> (posted August 10) to include numbers since the 10th? It was very
> interesting and you should keep it updated daily if possible to
> see if the trend is following 1929's slow hemorrhaging.
If I have time, I'll get it updated tonight.

Sincerely,

John

John J. Xenakis
E-mail: john@GenerationalDynamics.com
Web site: http://www.GenerationalDynamics.com

P.S.: What about you, Mike? Are you still as sanguine as ever about
the stock market?


Post#2431 at 08-16-2007 10:08 PM by John J. Xenakis [at Cambridge, MA joined May 2003 #posts 4,010]
---
08-16-2007, 10:08 PM #2431
Join Date
May 2003
Location
Cambridge, MA
Posts
4,010

Dear Matt,

Quote Originally Posted by MichaelEaston View Post
> John, can you detail how you calculate the "actual value" of the
> stock market?
See in here:

** 11% Solution
http://www.generationaldynamics.com/cgi-bin/D.PL?xct=gd.ww2010.i.050711eleven#ww2010.i.050711e leven


Sincerely,

John

John J. Xenakis
E-mail: john@GenerationalDynamics.com
Web site: http://www.GenerationalDynamics.com


Post#2432 at 08-16-2007 11:02 PM by 1990 [at Savannah, GA joined Sep 2006 #posts 1,450]
---
08-16-2007, 11:02 PM #2432
Join Date
Sep 2006
Location
Savannah, GA
Posts
1,450

Quote Originally Posted by John J. Xenakis View Post

If I have time, I'll get it updated tonight.

Sincerely,

John
Great. If you believe This Is It (TM) then you should update the chart daily. I don't have numbers from Friday the 10th, or Monday the 13th through yesterday. Hopefully you do. But for the record, here are the numbers from today: Dow at 12,845.78. The July 19 peak was 14,000.41. The Dow was (-0.12%) today from yesterday, and by my calculations is at 92% of its July 19 peak value.

Hope you have numbers for the last few days, because this chart could be VERY interesting indeed to watch over the rest of the year.
My Turning-based Map of the World

Thanks, John Xenakis, for hosting my map

Myers-Briggs Type: INFJ


Post#2433 at 08-17-2007 12:33 AM by Matt1989 [at joined Sep 2005 #posts 3,018]
---
08-17-2007, 12:33 AM #2433
Join Date
Sep 2005
Posts
3,018

Thanks!
Your link is broken. http://www.generationaldynamics.com/...i.050711eleven
The one you mean^^

What do you suppose happened to Mr. Barth?
Last edited by Matt1989; 08-17-2007 at 12:41 AM.


Post#2434 at 08-17-2007 12:35 AM by Matt1989 [at joined Sep 2005 #posts 3,018]
---
08-17-2007, 12:35 AM #2434
Join Date
Sep 2005
Posts
3,018

Quote Originally Posted by 1990 View Post
Great. If you believe This Is It (TM) then you should update the chart daily. I don't have numbers from Friday the 10th, or Monday the 13th through yesterday. Hopefully you do. But for the record, here are the numbers from today: Dow at 12,845.78. The July 19 peak was 14,000.41. The Dow was (-0.12%) today from yesterday, and by my calculations is at 92% of its July 19 peak value.

Hope you have numbers for the last few days, because this chart could be VERY interesting indeed to watch over the rest of the year.
It's not like they disappear!
http://finance.yahoo.com/q/hp?s=%5EDJI


Post#2435 at 08-17-2007 01:55 AM by Matt1989 [at joined Sep 2005 #posts 3,018]
---
08-17-2007, 01:55 AM #2435
Join Date
Sep 2005
Posts
3,018

London Falls

http://www.telegraph.co.uk/news/main...markets117.xml

Shares on the London stock market plunged yesterday in their biggest one-day fall for more than four years amid fears that the British economy could be badly damaged.


Post#2436 at 08-17-2007 02:05 AM by Tristan [at Melbourne, Australia joined Oct 2003 #posts 1,249]
---
08-17-2007, 02:05 AM #2436
Join Date
Oct 2003
Location
Melbourne, Australia
Posts
1,249

The Dow Jones has lost something like 1000 points lately, however it is still like 1000 points higher now than it was this time last year. When it peaked at 14,000 recently, it had increased by 75% since 2003. That is a very strong bull market by anybody terms. Infact the last 22 years has seen an bull market like no other. In 1985 the Dow Jones was 1500, in 2007 it peaked at 14,000.

If the Dow Jones was rising with Inflation and GDP growth, the index now would be around 6000-7000. Means stocks are still double in value than they should be.

In the next few years we will enter a bear market, however I doubt anything like the wall street crash of 1929 which saw the Dow Jones index fall from 381.17 on September 3, 1929 to 41.22 on July 8, 1932 will occur.
"The f****** place should be wiped off the face of the earth".

David Bowie on Los Angeles


Post#2437 at 08-17-2007 03:02 AM by Matt1989 [at joined Sep 2005 #posts 3,018]
---
08-17-2007, 03:02 AM #2437
Join Date
Sep 2005
Posts
3,018

Quote Originally Posted by Tristan View Post
The Dow Jones has lost something like 1000 points lately, however it is still like 1000 points higher now than it was this time last year. When it peaked at 14,000 recently, it had increased by 75% since 2003. That is a very strong bull market by anybody terms. Infact the last 22 years has seen an bull market like no other. In 1985 the Dow Jones was 1500, in 2007 it peaked at 14,000.

If the Dow Jones was rising with Inflation and GDP growth, the index now would be around 6000-7000. Means stocks are still double in value than they should be.

In the next few years we will enter a bear market, however I doubt anything like the wall street crash of 1929 which saw the Dow Jones index fall from 381.17 on September 3, 1929 to 41.22 on July 8, 1932 will occur.
What does this mean?? 1929 was a bull market like no other and just before the crash the market was higher than it was the previous year. So what's your reasoning?


Post#2438 at 08-17-2007 03:38 AM by Tristan [at Melbourne, Australia joined Oct 2003 #posts 1,249]
---
08-17-2007, 03:38 AM #2438
Join Date
Oct 2003
Location
Melbourne, Australia
Posts
1,249

Quote Originally Posted by MichaelEaston View Post
What does this mean?? 1929 was a bull market like no other and just before the crash the market was higher than it was the previous year. So what's your reasoning?
I was saying that recent crash in the stock market is probably over hyped.
"The f****** place should be wiped off the face of the earth".

David Bowie on Los Angeles


Post#2439 at 08-17-2007 11:29 AM by John J. Xenakis [at Cambridge, MA joined May 2003 #posts 4,010]
---
08-17-2007, 11:29 AM #2439
Join Date
May 2003
Location
Cambridge, MA
Posts
4,010

Dear Tristan,

Quote Originally Posted by Tristan View Post
> I was saying that recent crash in the stock market is probably
> over hyped.
What crash? What specific recent event is considered by you to be a
"crash"?

Sincerely,

John

John J. Xenakis
E-mail: john@GenerationalDynamics.com
Web site: http://www.GenerationalDynamics.com


Post#2440 at 08-17-2007 06:42 PM by catfishncod [at The People's Republic of Cambridge & Possum Town, MS joined Apr 2005 #posts 984]
---
08-17-2007, 06:42 PM #2440
Join Date
Apr 2005
Location
The People's Republic of Cambridge & Possum Town, MS
Posts
984

Quote Originally Posted by Tristan View Post
I was saying that recent crash in the stock market is probably over hyped.
Only yesterday did this officially become a "correction". True, it was a pretty quick correction, but a 10% drop is an accepted behavior of the market. That, plus the Fed sprinkling magic pixie dust this morning, is meant to make everyone think that this is the whole story. A correction was needed because of the subprime debt, we've purged it with this 1400 point drop and a few hedge fund collapses. Everything's fine, we can go back to business as usual, nothing to see, move along, pay no attention to the man behind the curtain.

I don't believe it. And when the next major piece of bad news comes along -- and it will, in days or weeks -- the bear market will resume.
'81, 30/70 X/Millie, trying to live in both Red and Blue America... "Catfish 'n Cod"


Post#2441 at 08-17-2007 06:57 PM by Matt1989 [at joined Sep 2005 #posts 3,018]
---
08-17-2007, 06:57 PM #2441
Join Date
Sep 2005
Posts
3,018

Quote Originally Posted by catfishncod View Post
Only yesterday did this officially become a "correction". True, it was a pretty quick correction, but a 10% drop is an accepted behavior of the market. That, plus the Fed sprinkling magic pixie dust this morning, is meant to make everyone think that this is the whole story. A correction was needed because of the subprime debt, we've purged it with this 1400 point drop and a few hedge fund collapses. Everything's fine, we can go back to business as usual, nothing to see, move along, pay no attention to the man behind the curtain.

I don't believe it. And when the next major piece of bad news comes along -- and it will, in days or weeks -- the bear market will resume.
I get the feeling that a major piece of bad news will just kill it. The talk may be that everything is OK, but the fact that everyone keeps repeating it just signals the nervousness. I think a lot of people are thinking, "Should I get out now?" but experts are saying the market has nowhere to go but up. My father's broker told him just that yesterday. The truth is that things are mighty unhealthy, and with the wildness taken to new heights over the past few days, I could see a major piece of bad news throwing the DJIA down 600 points.


Post#2442 at 08-17-2007 09:29 PM by 1990 [at Savannah, GA joined Sep 2006 #posts 1,450]
---
08-17-2007, 09:29 PM #2442
Join Date
Sep 2006
Location
Savannah, GA
Posts
1,450

The Dow recovered 1.82% today, bringing it back to 93% of its peak July 19 value. Analysts are euphoric, almost desperate to believe, that the correction is ALREADY OVER. Yeah, right.

If you do believe we are reliving 1929, you can look at Xenakis' fascinating 1929 comparison chart and see that the year was full of drops followed by fast but brief recoveries, with day-to-day numbers being all over the map. But the long-term trend was down week by week.
My Turning-based Map of the World

Thanks, John Xenakis, for hosting my map

Myers-Briggs Type: INFJ


Post#2443 at 08-18-2007 02:07 AM by puravidavid [at Carlsbad, California joined Dec 2006 #posts 68]
---
08-18-2007, 02:07 AM #2443
Join Date
Dec 2006
Location
Carlsbad, California
Posts
68

Total Stock Market Value.

Quote Originally Posted by MichaelEaston View Post
John, can you detail how you calculate the "actual value" of the stock market?
I'm not John, but this answers your question.

Per a NYSE website/press release: Over 3,500 companies have stocks listed on the NYSE, representing a total global market capitalization of US$26.5 trillion at December 31, 2006.

Per The Financial Times from London Stock Exchange report: Total global stock market capitalization at April 30, 2006 was US$43.5 trillion.

Footnote: This is dwarfed by non-share financial paper (derivatives and debt) which are estimated to be 3 to 4 times greater.
Follow the money but be led by your heart...


Post#2444 at 08-18-2007 11:30 PM by John J. Xenakis [at Cambridge, MA joined May 2003 #posts 4,010]
---
08-18-2007, 11:30 PM #2444
Join Date
May 2003
Location
Cambridge, MA
Posts
4,010

Stock Market: Stock Prices vs "Real Value"

Here are some graphs that illustrate how to estimate the current
"real value" of the stock market.

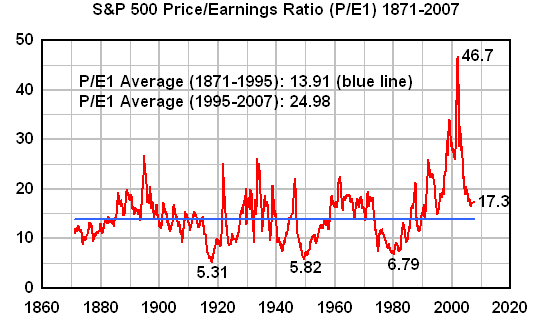
Method #1 - Price/Earnings Ratio

The following graph shows the S&P 500 Price/Earnings index for
1871-2007. For each company, it takes the stock price and divides by
the company's earnings for the previous year per share of stock. The
term "P/E1" means "price divided by previous year's earnings."


Informally, you can think of the P/E ratio as the number of years it
will take to get your investment back. This isn't precise, but it's
based on the following reasoning: Suppose that the P/E ratio is 20.
That means that if you pay $100 per share, then the company earns $5
per share each year. Theoretically those earnings will be returned
to you in the form of either a higher stock price or dividend payout.
So theoretically you'll make $5 per year one way or the other, and
you'll get your $100 back in 20 years.

Another way of looking at it is as the reciprocal of the interest
rate. If you pay $100 for a share of stock, and you get back $5 per
year, then you're earning 5% interest per year, and 1/20 = 5%.

Historically, the P/E ratio averages around 14 (which corresponds to
about 7% interest). Pundits often use the word "valuations" as a
synonym for price/earnings ratios.

Historically, P/E ratios have been considered a very important
indicator of the value of a share of stock. But in the last ten
years, journalists, pundits and analysts have taken to out and out
lying about P/E ratios. Why? Because P/E ratios have been way above
average since the dot-com bubble began in 1995, as you can see from
the above graph.

Here are some of the out and out lies that I've heard on TV and seen
in print:
  • "Valuations today are around 13-14, which is below average, so
    everything is OK."

    The way they get this is as follows: They take today's stock price,
    and they divide it by the company's estimates of NEXT YEAR's
    earnings. That gives the earnings a nice boost of 10-20%, which
    gives a phony P/E ratio figure.
  • "Valuations today are around 16, which is average, so
    everything is OK."

    No, valuations today are around 17, which is above average.
  • "Valuations today are around 16-17, which is very close to
    average, so everything is OK."

    Here the big problem is ignoring the Law of Mean Reversion.

    This means the following: 14 is AVERAGE, not the MINIMUM. If the P/E
    ratio has been mostly WELL ABOVE average since 1995, then it has to
    be mostly WELL BELOW average from now on, so that the average for the
    entire period is 14.
  • "Valuations could never get much lower than they are today, so
    everything is OK."

    This is the "it's different this time" excuse that people use prior
    to the bursting of every bubble in history.

    If you look at the above graph, you can easily see that the P/E ratio
    that the ratio has been above average (the blue line) since 1995, and
    has been as low as 6 several times in the last century, most recently
    at 6.79 in 1980.

    Now, if it's fallen to around 6 several times in the past, then it's
    going to fall below 6 again. There's no doubt it, except in the
    fantasies of people living in denial.

    If you look at the right hand side of the graph, you can see that it
    appears to be about to fall to that level right now, or in the very
    near future.


What will the value of the stock market be when it falls to 6 again?

Well, it's around 17 today, so a fall to 6 would bring stock prices
down by a factor of 6/17, assuming earnings stay the same. So if the
market is at Dow 13079 today, then it will fall to Dow 13079*(6/17) =
4616. If we assume that earnings will fall, rather than staying the
same, then the market will fall even lower.

Actually, a fall in earnings is to be expected, so the market should
fall to well below Dow 4616, at least for a while until earnings are
restored.

Method #2 - Exponential Growth Estimate

Over long periods of time, many quantities in nature grow
exponentially. This is true of such things as population variables,
many technology variables, and many financial variables. It's
true of the "real value" of a collection of companies, and therefore
it's true of stock prices, which are supposed to represent the "real
value" of these companies.

Therefore, we can take a graph of stock prices and do "exponential
curve fitting," to get the best-fit exponential curve that matches
the stock prices.

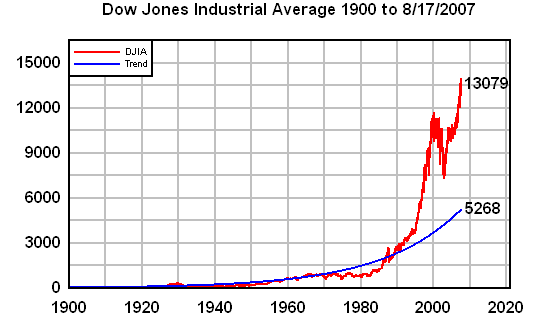
Here's the graph for the Dow Jones Industrial Average since 1900:


The red curve is the actual stock index, and the blue curve is the
best-fit exponential curve.

The above graph is hard to read because prices have been so high
since 1995 that points on the graph prior to 1940 are hard to
distinguish.

So here's the same graph, but restricted to the years 1900-1940:


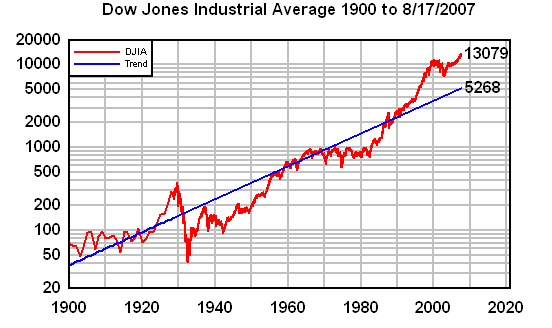
If you want to be able to read the entire graph, from 1900 to the
present, the best way is to view it with a logarithmic Y-axis:


On this graph, the exponential curve becomes a straight line, and you
can easily read values off the graph for all years.

The blue line as the "real value" of the companies represented, and
it's determined by exponential curve fitting to the stock price,
which assumes that, over the long run, the stock price represents the
"real value" of the companies.

So you can see that on Friday, the Dow was at 13079, but the "real
value" of the market was at 5268. This is not so far from the value
4616 that we got from Method #1, examining P/E ratios.

But there's more: Remember from Method #1 that we said that the market
should be expected to fall well below 4616 for a while. Well, we
reach the same conclusion with Method #2.

In the case of exponential growth, we have a Law of Trend Reversion
which is similar to the Law of Mean Reversion: If stock values have
been well above the trend line for the last 12 years, then they will
have to be well below the trend line for the next 12 years.

Here's another way to look at it: From 1904 to 1994, the Dow averaged
4.5% growth per year. That number, 4.5%, represents the true growth
rate for these companies. But for the last 20 years, the Dow average
9.7% growth per year, which is about 5% per year too high.

Are the Laws of Mean Reversion and Trend Reversion real laws? Yes,
they are, as real as the Law of Gravity. And just as people have
tried to defeat the Law of Gravity for thousands of years, investors
and Fed Chairmen today want to believe that "this time it's
different," and that they've found a way to defeat these laws. They
haven't.

Actually, if you look at the graphs above, and compare what happened
in 1929 versus where we are today, you see a striking difference: In
1929 the market collapsed precipitously, and kept falling for four
years, until the worst was over.

But that didn't happen after the dot-com crash in 2000, as you can
see from the graphs. Instead, the Fed, dropped interest rates to
near-zero, thus expanding the bubble for another few years. The
result is that today the bubble is much huger, and the collapse is
going to be much, much uglier than the 1929 crash.

Method #3 - "The 11% Solution"

This is not my method -- the name is the title of an article that
appeared in 2005 in Barron's and that I wrote about,
** 11% Solution - Adam Barth - Barrons
http://www.generationaldynamics.com/cgi-bin/D.PL?d=ww2010.i.050711eleven


It makes the following points:
  • Average earnings of a company over any 20-year period between
    1920 and 1986 (1920-39, 1921-40, 1922-41, etc.) consistently equal 11%
    of the company's book value. This 11% represents the average Return
    on Earnings (ROE) of these companies. "Average earnings as a function
    of book value barely varies in the slightest, and has remained
    basically immune to inflation, wars, massive changes in the tax code
    or any other external factor."
  • However, the Dow has average an 18% ROE from 1995 to 2005, which
    is 7% above the historical average. Thus, by the Law of Trend
    Reversion, the ROE will have to grow at a rate 7% below average for
    the same period of time.

    In fact, as of second quarter, 2007, earnings growth has indeed
    finally fallen down to the 4% range.
  • Average book value has increased by 4.8% per year for every
    20-year period from 1920-2003. (Notice that this figure, 4.8%, is
    very close to the 4.5% that represents the historical "real" growth
    rate of the Dow.)
  • The article shows that historically the Dow has averaged 1.5
    times book value. Since the average book value of Dow companies
    around 3000, the value of the stock market is around Dow
    4,500.

    By the Law of Trend Reversion, the market will have to fall well
    below 4500 for a while.


Summary

So we have three methods, producing these results: Dow 4618, 5268 and
4500.

These numbers represent that approximate "real value" of the stock
market today, at least for the 30 Dow Industrials stocks. However,
the same computations work and produce similar results for the much
broader S&P 500 stocks.

It's worth repeating the point I've made before: These methods are
all quite reasonable, and the only reason that they're not considered
acceptable today is because they give results that people don't want
to hear.

Before every bubble bursts, people always say, "This time it's
different." They were saying that last year for the housing bubble,
and now look where we are.

Here's an article from tomorrow's NY Times that explains how the "old
timers saw this coming" a while ago, and asks why everyone else
missed it.
http://www.nytimes.com/2007/08/19/business/19credit.html

The stock market bubble is a huge bubble. As I've said before, think
of the world economy as a huge, enormous bloated mansion made of
wood, with all kinds of additions tacked on all over the place.
Think of the mortgage-based securities (CDOs) as tens or hundreds of
trillions of termites that are eating away at the insides, so that
another piece of the mansion falls off into the ravine almost every
day, and it won't be long before the entire house falls into the
ravine.

Every day that passes makes more astounded about what's happened with
CDOs (collateralized debt obligations). The sheer immensity of
what's happened is so mind-boggling that it's not surprising that
almost everyone is oblivious to it, because it's almost too
incredible to believe. If this were a novel, noone would even find
it credible.

Financiers began giving away loans for mortgages -- and there were/are
tens of millions of them. The mortgages were packaged into bundles,
or "tranches," of equal risks, so that securities in a low-risk
tranche would be rated AAA, and a high-risk (subprime mortgage)
tranche would be rated BBB-.

But nobody wants high-risk securities, and so these found a gimmick
to slice and dice and repackage the BBB and BBB- securities into a
new kind of security, a CDO, so that it had an AAA rated. This is the
mind-boggling thing.
** Redemptions of money market funds now fully in doubt
http://www.generationaldynamics.com/cgi-bin/D.PL?xct=gd.e070815#e070815


Furthermore, in repackaging them into CDOs, they leveraged them so
that, all told, their values total in the tens or hundreds of
trillions of dollars and, like little termites, they've gnawed their
way into every portofolio in almost every organization. And it's
becoming more and more apparent to everyone that these CDOs aren't
worth the paper their written on.

Sincerely,

John

John J. Xenakis
E-mail: john@GenerationalDynamics.com
Web site: http://www.GenerationalDynamics.com


Post#2445 at 08-19-2007 01:07 AM by John J. Xenakis [at Cambridge, MA joined May 2003 #posts 4,010]
---
08-19-2007, 01:07 AM #2445
Join Date
May 2003
Location
Cambridge, MA
Posts
4,010

It's 1 am and I've just been looking at the P/R ratio chart at the
beginning of the last message through very bleary eyes, and I just
noticed something I've never noticed before:

The three points that I labeled as lows (5.31, 5.82 and 6.79)
occurred at 31-year intervals. (But there's nothing like that in
1887.) There wasn't even a low 1932, the worst part of the crash.

Could there be a 31-year cycle? If so, then the next low is in 2011,
and so the market will be crashing brutally for four years (same as
1929).

Well, maybe it will look different in the morning.

Sincerely,

John

John J. Xenakis
E-mail: john@GenerationalDynamics.com
Web site: http://www.GenerationalDynamics.com


Post#2446 at 08-19-2007 06:51 AM by mattzs [at joined Mar 2007 #posts 201]
---
08-19-2007, 06:51 AM #2446
Join Date
Mar 2007
Posts
201

Quote Originally Posted by John J. Xenakis View Post
It's 1 am and I've just been looking at the P/R ratio chart at the
beginning of the last message through very bleary eyes, and I just
noticed something I've never noticed before:

The three points that I labeled as lows (5.31, 5.82 and 6.79)
occurred at 31-year intervals. (But there's nothing like that in
1887.) There wasn't even a low 1932, the worst part of the crash.

Could there be a 31-year cycle? If so, then the next low is in 2011,
and so the market will be crashing brutally for four years (same as
1929).

Well, maybe it will look different in the morning.

Sincerely,

John

John J. Xenakis
E-mail: john@GenerationalDynamics.com
Web site: http://www.GenerationalDynamics.com
I'd say 4 years is about right, the Nikkei topped in '90 and bottomed in '93 with the ultimate low in '03. The Feds attempted bailouts might draw it out a bit longer.
Dori: The terrorist has demanded a million dollars, a private jet and an end to the Star Wars program.
Sledge Hammer: Yeah, three movies was enough.
http://www.youtube.com/watch?v=irp8C...related&search=


Post#2447 at 08-19-2007 02:35 PM by John J. Xenakis [at Cambridge, MA joined May 2003 #posts 4,010]
---
08-19-2007, 02:35 PM #2447
Join Date
May 2003
Location
Cambridge, MA
Posts
4,010

Quote Originally Posted by puravidavid View Post
> Total Stock Market Value.

> I'm not John, but this answers your question.

> Per a NYSE website/press release: Over 3,500 companies have stocks
> listed on the NYSE, representing a total global market
> capitalization of US$26.5 trillion at December 31, 2006.

> Per The Financial Times from London Stock Exchange report: Total
> global stock market capitalization at April 30, 2006 was US$43.5
> trillion.

> Footnote: This is dwarfed by non-share financial paper
> (derivatives and debt) which are estimated to be 3 to 4 times
> greater.
OK, so if the NYSE's total capitalization is $26.5 trillion, and if,
as I've computed, the NYSE is overpriced by a factor of 250%, then
the "real value" of the underlying companies must be 40%*$26.5
trillion = $10.6 trillion. Do you have any figures that either
support or refute the $10.6 trillion figure?

Sincerely,

John

John J. Xenakis
E-mail: john@GenerationalDynamics.com
Web site: http://www.GenerationalDynamics.com


Post#2448 at 08-19-2007 02:37 PM by John J. Xenakis [at Cambridge, MA joined May 2003 #posts 4,010]
---
08-19-2007, 02:37 PM #2448
Join Date
May 2003
Location
Cambridge, MA
Posts
4,010

Quote Originally Posted by mattzs View Post
> I'd say 4 years is about right, the Nikkei topped in '90 and
> bottomed in '93 with the ultimate low in '03. The Feds attempted
> bailouts might draw it out a bit longer.
Thanks for pointing that out.

I'm testing out the following theory: Once the panic starts for
real, it spreads like wildfire. Now, it takes a while for wildfire
to spread, but the theory is that panic spreads at a certain rate
that's irrespective of the country or time in history.

The theory is that the wildfire spreads to a generational stock
market crash in about 7-8 weeks, and burns itself out in about 4
years.

In this case, we count the panic as starting when the market peaks,
which would be July 19. In 1929 the market peaked on 9/3, and the
generational crash began on 10/24. The wildfire then burned itself
out in 1933. That's where we get the 7 week / 4 year figures from.

The comparison to Japan in the 1990s is perceptive, since that was a
generational panic and crash as well, just like 1929 and what we're
facing today. The previous major stock market crash at the Tokyo
Stock Exchange (TSE) was in 1919.

So you have: Wall Street: Crash in 1929, new bubble in 1995, 66 years
later; Tokyo Stock Exchange: Crash in 1919, new bubble in 1984, 65
years later.
** Japan's real estate crash may finally end after 16 years
http://www.generationaldynamics.com/cgi-bin/D.PL?xct=gd.e070220#e070220


Here are some graphs from July showing the Nikkei index:
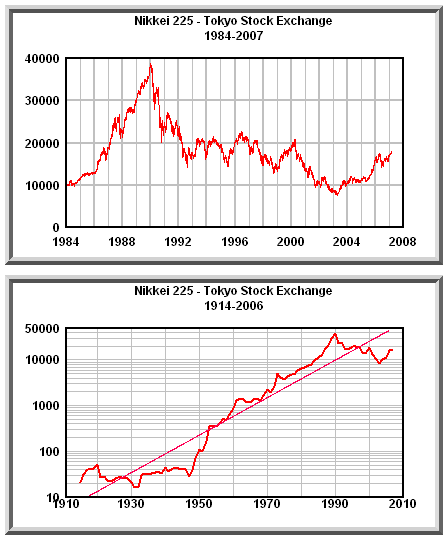


The first chart shows, as you point out, that the crash began
January 4, 1990, and burned itself out about three years later. The
second chart shows that the same thing was true for the 1919 crash.

Now here's a chart that gives more detail on the TSE 1990 crash:
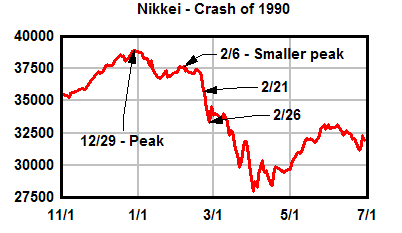


The peak was reached on 12/29, and the crash began on 2/21, about 7
weeks later. So this supports a 7-8 week theory.

A web site reader wrote to me this morning to tell me he's done a
little research on the 1720 South Sea Bubble. The stock peaked at
1000 on Aug 1, and crashed to 700 around September 1. By October 1,
it was at 135.

This is faster than we're talking about, but there isn't enough
information, because that's only one stock, and we're looking for a
reading on the entire stock market. Still, if one stock crashed in
four weeks, then it's reasonable to think that the entire stock market
crashed in 7-8 weeks. That needs more research, of course.

So, if this theory is true, then we'll experience a stock market
crash somewhere around September 10-24, and the crash will burn
itself out around 2011.

This isn't a prediction, of course. It's a theory that's being
tested in real time.

This is really exciting stuff. I just wish that there weren't so
much at stake. No wonder I'm totally obsessed with this -- I
experience overwhelming fascination one minute and overwhelming dread
and depression the next minute.

Sincerely,

John

John J. Xenakis
E-mail: john@GenerationalDynamics.com
Web site: http://www.GenerationalDynamics.com


Post#2449 at 08-19-2007 03:47 PM by mattzs [at joined Mar 2007 #posts 201]
---
08-19-2007, 03:47 PM #2449
Join Date
Mar 2007
Posts
201

Quote Originally Posted by John J. Xenakis View Post
Thanks for pointing that out.

I'm testing out the following theory: Once the panic starts for
real, it spreads like wildfire. Now, it takes a while for wildfire
to spread, but the theory is that panic spreads at a certain rate
that's irrespective of the country or time in history.

The theory is that the wildfire spreads to a generational stock
market crash in about 7-8 weeks, and burns itself out in about 4
years.

In this case, we count the panic as starting when the market peaks,
which would be July 19. In 1929 the market peaked on 9/3, and the
generational crash began on 10/24. The wildfire then burned itself
out in 1933. That's where we get the 7 week / 4 year figures from.

The comparison to Japan in the 1990s is perceptive, since that was a
generational panic and crash as well, just like 1929 and what we're
facing today. The previous major stock market crash at the Tokyo
Stock Exchange (TSE) was in 1919.

So you have: Wall Street: Crash in 1929, new bubble in 1995, 66 years
later; Tokyo Stock Exchange: Crash in 1919, new bubble in 1984, 65
years later.
** Japan's real estate crash may finally end after 16 years
http://www.generationaldynamics.com/cgi-bin/D.PL?xct=gd.e070220#e070220


Here are some graphs from July showing the Nikkei index:


The first chart shows, as you point out, that the crash began
January 4, 1990, and burned itself out about three years later. The
second chart shows that the same thing was true for the 1919 crash.

Now here's a chart that gives more detail on the TSE 1990 crash:


The peak was reached on 12/29, and the crash began on 2/21, about 7
weeks later. So this supports a 7-8 week theory.

A web site reader wrote to me this morning to tell me he's done a
little research on the 1720 South Sea Bubble. The stock peaked at
1000 on Aug 1, and crashed to 700 around September 1. By October 1,
it was at 135.

This is faster than we're talking about, but there isn't enough
information, because that's only one stock, and we're looking for a
reading on the entire stock market. Still, if one stock crashed in
four weeks, then it's reasonable to think that the entire stock market
crashed in 7-8 weeks. That needs more research, of course.

So, if this theory is true, then we'll experience a stock market
crash somewhere around September 10-24, and the crash will burn
itself out around 2011.

This isn't a prediction, of course. It's a theory that's being
tested in real time.

This is really exciting stuff. I just wish that there weren't so
much at stake. No wonder I'm totally obsessed with this -- I
experience overwhelming fascination one minute and overwhelming dread
and depression the next minute.

Sincerely,

John

John J. Xenakis
E-mail: john@GenerationalDynamics.com
Web site: http://www.GenerationalDynamics.com
Here is another 4 year cycle.

http://www.financialsense.com/Market...2007/0727.html
Dori: The terrorist has demanded a million dollars, a private jet and an end to the Star Wars program.
Sledge Hammer: Yeah, three movies was enough.
http://www.youtube.com/watch?v=irp8C...related&search=


Post#2450 at 08-19-2007 04:16 PM by mattzs [at joined Mar 2007 #posts 201]
---
08-19-2007, 04:16 PM #2450
Join Date
Mar 2007
Posts
201

Dollar

Currency question. Assuming the Fed does not monetize the debt will the demand for dollars (to repay debt) drive the dollar up? The Japanese yen trended opposite to their stock market ('90 to '94).

http://charts.barchart.com/custom/stocks/5389.gif
Dori: The terrorist has demanded a million dollars, a private jet and an end to the Star Wars program.
Sledge Hammer: Yeah, three movies was enough.
http://www.youtube.com/watch?v=irp8C...related&search=
-----------------------------------------