Generational Dynamics
Fourth Turning Forum Archive


Popular links:
Generational Dynamics Web Site
Generational Dynamics Forum
Fourth Turning Archive home page
New Fourth Turning Forum

Thread: Objections to Generational Dynamics - Page 99


Post#2451 at 08-19-2007 04:58 PM by puravidavid [at Carlsbad, California joined Dec 2006 #posts 68]
---
08-19-2007, 04:58 PM #2451
Join Date
Dec 2006
Location
Carlsbad, California
Posts
68

Asset Pricing and Predictions

Quote Originally Posted by John J. Xenakis View Post
OK, so if the NYSE's total capitalization is $26.5 trillion, and if, as I've computed, the NYSE is overpriced by a factor of 250%, then the "real value" of the underlying companies must be 40%*$26.5 trillion = $10.6 trillion. Do you have any figures that either
support or refute the $10.6 trillion figure?
The answer to your question provides little basis for productive asset allocation decision making going forward in time. But, for the sake of conversation, given the dollar index decline from 120 to 80 over the past few years, whatever the nominal price of all equities today, you can suggest it is worth approximately 40% less than comparable index levels in 2004, or about $16 trillion.

The real question is how do we calculate the values one, five and ten years from now in constant purchasing power dollars.

Milton Friedman's Nobel prize winning equation is predictive. (MV=PO, where M is the change in the money supply, V is the velocity at which it changes hands, P is the change in prices and O is the change in output of goods and services.) "All inflation," he said, "At all times and all places is the result of changes in money supply." "All" means prices for anything and everything, not just "core" items, but energy, food, housing, medical care, capital goods, and financialized things: shares, bonds, synthetics, and realty.

Given the exponential increase in money supply over the past decade, we have witnessed how it fueled speculative pricing through a series of financialized asset classes. The "irrationally exuberant" High tech stocks in the 1990's were the first to boom then bust. The Fed rushed to prevent deflation (M and V were dropping) by lowering the price of money to 1% and enabling irrational home lending that began in 2002. It is busting now.

How severely will the contagion spread from defaulting sub-prime home loans to the investors who bought the bonds backed by these loans that are backed by overvalued property, and ultimately into the greater economy through lower consumer spending, corporate profits, employment and so on? If those who know are fudging the numbers (growth, employment, inflation "facts" are Administration spin ala "progress" in Iraq), or aren't talking - or at least aren't speaking without near-total opacity - you can bet that those who don't know are speaking volumes... and either out of laughable self-interest or a more understandable fearful uncertainty.

Here is the dismal social/political prediction:

It is the fearful uncertainty that always eventually overwhelms the happy talk of insiders. But, only when the crisis crushes a large portion of the electorate who scream for bailouts and help. That's when we'll hear from the demagogues and populists... just in time for the sheeple to want a stong leader to take them from the high-unemployment homeless hunger fiasco into some imagined promised land.

Here is the dismal financial prediction:

I submit that the stock market downturn that began in January 2000, was interrupted by the Fed's policy of turning the nation's housing stock into ATM machines which fueled the (IMHO) dead-cat bounce from 2003 to July 2007. Having concluded the bull trap leg up, the markets will recommence the bear market begun seven years ago. It now has more pent-up speculation to shed and has that much more ephemeral pricing to jettison.

That brings us back to the question: "How big will the correction be?" I submit that the mistakes that have been made require a sea full of white-out. If Japan's experience doesn't repeat, but mearly paraphrases, our dollar-denominated assets will bottom near 25% to 40% of current valuations in the 5 to 20 year future.

I know this is a huge window in terms of percentage and time, but hey, most of the time, most of us are mostly guessing. Right?
Follow the money but be led by your heart...


Post#2452 at 08-19-2007 05:21 PM by puravidavid [at Carlsbad, California joined Dec 2006 #posts 68]
---
08-19-2007, 05:21 PM #2452
Join Date
Dec 2006
Location
Carlsbad, California
Posts
68

The Yen, The Dollar and Global Speculation

Quote Originally Posted by mattzs View Post
Currency question. Assuming the Fed does not monetize the debt will the demand for dollars (to repay debt) drive the dollar up? The Japanese yen trended opposite to their stock market ('90 to '94).
The Yen strengthened for several factors that existed in Japan that don't here.

1. Their crash produced deflation that crushed borrowing, increased savings and reduced government fiscal irresponibility.

2. Their balance of trade was positive and lucrative.

The dollar's prospects will fare far worse as the Fed resorts to prevent the unraveling caused by excess liquidity by injecting more liquidity. Sure, we don't want markets to seize up, but then again, nothing is worth more than the discounted future cash flow it will produce, and all financialized assets are priced in excess of this metric.

Foreign central bankers who hold large dollar (currency and bond) positions are not standing idly by as the Fed increases money supply on an emergency basis. These balances vastly exceed those that will be unwound in carry-trade pinches. It is the larger pool of dollars that over the longer horizon will seek havens from policy decisions that devalue the purchasing power of the dollar. True, all other central bankers have been creating credit/money at the pace of the Fed (or greater). They've had to to keep export prices in their domestic currencies competitive.

Given this historically unprecedented (and foolish) late-stage pump-priming, look for all markets globally to prejudicously reprice the deferred risk and speculative excesses over the next several years.

Ultimately, we will know better after all the fecal material stikes the rotating air thruster.
Follow the money but be led by your heart...


Post#2453 at 08-19-2007 06:13 PM by Matt1989 [at joined Sep 2005 #posts 3,018]
---
08-19-2007, 06:13 PM #2453
Join Date
Sep 2005
Posts
3,018

Quote Originally Posted by John J. Xenakis View Post
The comparison to Japan in the 1990s is perceptive, since that was a
generational panic and crash as well, just like 1929 and what we're
facing today. The previous major stock market crash at the Tokyo
Stock Exchange (TSE) was in 1919.

So you have: Wall Street: Crash in 1929, new bubble in 1995, 66 years
later; Tokyo Stock Exchange: Crash in 1919, new bubble in 1984, 65
years later.
Generational financial cycles run independent of plain old generational cycles, but it looks like we're going to get a 1-2 punch.

This supports the theory that catastrophic events can play the crucial role in determining a generation's legacy. So while we all like to blame Boomers, Generation X and the Millenials are just as unprepared and clueless when it comes to handling setback and failure... and not panicking. 5th Turnings ARE possible.


Post#2454 at 08-19-2007 09:54 PM by mattzs [at joined Mar 2007 #posts 201]
---
08-19-2007, 09:54 PM #2454
Join Date
Mar 2007
Posts
201

Quote Originally Posted by puravidavid View Post
The Yen strengthened for several factors that existed in Japan that don't here.

1. Their crash produced deflation that crushed borrowing, increased savings and reduced government fiscal irresponibility.

2. Their balance of trade was positive and lucrative.

The dollar's prospects will fare far worse as the Fed resorts to prevent the unraveling caused by excess liquidity by injecting more liquidity. Sure, we don't want markets to seize up, but then again, nothing is worth more than the discounted future cash flow it will produce, and all financialized assets are priced in excess of this metric.

Foreign central bankers who hold large dollar (currency and bond) positions are not standing idly by as the Fed increases money supply on an emergency basis. These balances vastly exceed those that will be unwound in carry-trade pinches. It is the larger pool of dollars that over the longer horizon will seek havens from policy decisions that devalue the purchasing power of the dollar. True, all other central bankers have been creating credit/money at the pace of the Fed (or greater). They've had to to keep export prices in their domestic currencies competitive.

Given this historically unprecedented (and foolish) late-stage pump-priming, look for all markets globally to prejudicously reprice the deferred risk and speculative excesses over the next several years.

Ultimately, we will know better after all the fecal material stikes the rotating air thruster.
The best course of action for the Fed would be to do nothing. The only other option is the Weimar way out.

http://en.wikipedia.org/wiki/Image:Inflation-1923.jpg
Dori: The terrorist has demanded a million dollars, a private jet and an end to the Star Wars program.
Sledge Hammer: Yeah, three movies was enough.
http://www.youtube.com/watch?v=irp8C...related&search=


Post#2455 at 08-20-2007 11:31 PM by Cynic Hero '86 [at Upstate New York joined Jul 2006 #posts 1,285]
---
08-20-2007, 11:31 PM #2455
Join Date
Jul 2006
Location
Upstate New York
Posts
1,285

Quote Originally Posted by MichaelEaston View Post
Generational financial cycles run independent of plain old generational cycles, but it looks like we're going to get a 1-2 punch.

This supports the theory that catastrophic events can play the crucial role in determining a generation's legacy. So while we all like to blame Boomers, Generation X and the Millenials are just as unprepared and clueless when it comes to handling setback and failure... and not panicking. 5th Turnings ARE possible.

I disagree about fifth turnings, becuase by that logic every crisis era america had so far would have to been a fifth turning. No america's cycle is very distinct and right now we are witnessing the changeover from 3T to 4T. When the crash occurs, either later this year or if not, next year. THAT is when we be 4T and it will be apparent to all.


Post#2456 at 08-20-2007 11:40 PM by Matt1989 [at joined Sep 2005 #posts 3,018]
---
08-20-2007, 11:40 PM #2456
Join Date
Sep 2005
Posts
3,018

Quote Originally Posted by Cynic Hero '86 View Post
I disagree about fifth turnings, becuase by that logic every crisis era america had so far would have to been a fifth turning. No america's cycle is very distinct and right now we are witnessing the changeover from 3T to 4T. When the crash occurs, either later this year or if not, next year. THAT is when we be 4T and it will be apparent to all.
....No. Fifth turnings happen 80 through 100 years after the end of last Crisis. So for example, World War Two occurred in a Fourth Turning.

In order to prove that fifth turnings don't exist, do a complete historical analysis of countries we suspect are in a 5T. You continually make vast, generalized statements without any basis. Do what I said, then come talk to me.


Post#2457 at 08-21-2007 09:22 AM by mattzs [at joined Mar 2007 #posts 201]
---
08-21-2007, 09:22 AM #2457
Join Date
Mar 2007
Posts
201

Market

I think a retest of the '02 lows are a good target, 7,500 dji and 800 spx. SSEC has to be getting close to imploding, rallies are getting weak.

http://stockcharts.com/c-sc/sc?s=$SS...4248674&r=5986
Dori: The terrorist has demanded a million dollars, a private jet and an end to the Star Wars program.
Sledge Hammer: Yeah, three movies was enough.
http://www.youtube.com/watch?v=irp8C...related&search=


Post#2458 at 08-21-2007 12:04 PM by Cynic Hero '86 [at Upstate New York joined Jul 2006 #posts 1,285]
---
08-21-2007, 12:04 PM #2458
Join Date
Jul 2006
Location
Upstate New York
Posts
1,285

Quote Originally Posted by MichaelEaston View Post
....No. Fifth turnings happen 80 through 100 years after the end of last Crisis. So for example, World War Two occurred in a Fourth Turning.

In order to prove that fifth turnings don't exist, do a complete historical analysis of countries we suspect are in a 5T. You continually make vast, generalized statements without any basis. Do what I said, then come talk to me.
But remember america's total war have always occured about 75-80 years after the end of the last total war. 1782 + 79 = 1861, 1865 + 76 = 1941, therefore Using this method we arrive at war between 2021 and 2024. This fits with the idea of the crisis ending between 2025 and 2028 and the 1T in the late 2020's to early 2040's.


Post#2459 at 08-21-2007 12:09 PM by 1990 [at Savannah, GA joined Sep 2006 #posts 1,450]
---
08-21-2007, 12:09 PM #2459
Join Date
Sep 2006
Location
Savannah, GA
Posts
1,450

Quote Originally Posted by Cynic Hero '86 View Post
But remember america's total war have always occured about 75-80 years after the end of the last total war. 1782 + 79 = 1861, 1865 + 76 = 1941, therefore Using this method we arrive at war between 2021 and 2024. This fits with the idea of the crisis ending between 2025 and 2028 and the 1T in the late 2020's to early 2040's.
But it was 93 years between 1689 and 1782. And 101 years between 1588 and 1689. That said, I do expect that if there is a crisis war this round, it will be in the early 2020s, climaxing quickly and leading to a 1T by 2026 or '27.
My Turning-based Map of the World

Thanks, John Xenakis, for hosting my map

Myers-Briggs Type: INFJ


Post#2460 at 08-21-2007 12:14 PM by 1990 [at Savannah, GA joined Sep 2006 #posts 1,450]
---
08-21-2007, 12:14 PM #2460
Join Date
Sep 2006
Location
Savannah, GA
Posts
1,450

Okay, anticlimactic as it may be, I don't think the stock panic is here. After getting as low as 91% of their peak July 19 value, stocks are rebounding, up to 94% yesterday and up again today. This is barely a correction, this is nothing.

Do 4Ts really need a dramatic economic panic? Maybe the economy just won't be as central to this 4T as it was to the last.
My Turning-based Map of the World

Thanks, John Xenakis, for hosting my map

Myers-Briggs Type: INFJ


Post#2461 at 08-21-2007 12:34 PM by Matt1989 [at joined Sep 2005 #posts 3,018]
---
08-21-2007, 12:34 PM #2461
Join Date
Sep 2005
Posts
3,018

Quote Originally Posted by Cynic Hero '86 View Post
But remember america's total war have always occured about 75-80 years after the end of the last total war. 1782 + 79 = 1861, 1865 + 76 = 1941, therefore Using this method we arrive at war between 2021 and 2024. This fits with the idea of the crisis ending between 2025 and 2028 and the 1T in the late 2020's to early 2040's.
That's all well and good, but you've only considered one country and two sets of data. Inter(total)-war periods are all over the place. I have no idea when it's going to start. It could be 2009, 2015, or 2020. We are in a generational Crisis era, or are at least beginning to enter one. All we need is for events to fall into place. Like I said, I don't know exactly when this is going to happen, but I don't think we're decades away, since there are too many scenarios in which a Crisis can form.


Post#2462 at 08-21-2007 12:39 PM by Matt1989 [at joined Sep 2005 #posts 3,018]
---
08-21-2007, 12:39 PM #2462
Join Date
Sep 2005
Posts
3,018

Quote Originally Posted by 1990 View Post
Okay, anticlimactic as it may be, I don't think the stock panic is here. After getting as low as 91% of their peak July 19 value, stocks are rebounding, up to 94% yesterday and up again today. This is barely a correction, this is nothing.
Investors are still very nervous. All it will take is some bad news to throw it violently down.

Do 4Ts really need a dramatic economic panic? Maybe the economy just won't be as central to this 4T as it was to the last.
No dramatic economic panic is necessary. Generational financial cycles run independent of "regular" generational cycles. For example, the South Sea Bubble panic occurred in 1720. However, being that we are in a generational Crisis era today and we have a massively overpriced stock market bubble, it will be central to this 4T.


Post#2463 at 08-21-2007 11:13 PM by John J. Xenakis [at Cambridge, MA joined May 2003 #posts 4,010]
---
08-21-2007, 11:13 PM #2463
Join Date
May 2003
Location
Cambridge, MA
Posts
4,010

Quote Originally Posted by 1990 View Post
> Okay, anticlimactic as it may be, I don't think the stock panic is
> here. After getting as low as 91% of their peak July 19 value,
> stocks are rebounding, up to 94% yesterday and up again today.
> This is barely a correction, this is nothing.

> Do 4Ts really need a dramatic economic panic? Maybe the economy
> just won't be as central to this 4T as it was to the
> last.
Famous last words.

John


Post#2464 at 08-27-2007 09:09 PM by AlexMnWi [at Minneapolis joined Jun 2002 #posts 1,622]
---
08-27-2007, 09:09 PM #2464
Join Date
Jun 2002
Location
Minneapolis
Posts
1,622

This week (or two) will tell.

This parallel is mostly holding up. Our percentages now are higher than in 1929, but they do otherwise parallel so far, with both a "minipeak" and preceding low lining up well. If the trend continues, this week should be a downer, but maybe only two percent or so. Next week, which is coincidentally the first week of September - in the past, this has meant that vacationing traders return and volume goes up significantly. Even in this decade, volume graphs show a noticable slide in August activity, with this year being a significant exception. I'd expect more volatility in September if this trend holds up. If not, or if this week keeps going up, then the parallels so far may have been a fluke.

1929 % of peak (381.17)
-------------------------
Tue 09-03 ( +0.22%) 100% 2007 % of peak (14000)
Wed 09-04 ( -0.41%) 99% ------------------------
Thu 09-05 ( -2.59%) 97% Thu 07-19 (+0.59%) 100%
Fri 09-06 ( +1.76%) 98% Fri 07-20 (-1.07%) 98.9%
------------------------ ------------------------
Mon 09-09 ( -0.36%) 98% Mon 07-23 (+0.67%) 99.6%
Tue 09-10 ( -2.04%) 96% Tue 07-24 (-1.62%) 98.0%
Wed 09-11 ( +0.99%) 97% Wed 07-25 (+0.50%) 98.5%
Thu 09-12 ( -1.23%) 96% Thu 07-26 (-2.26%) 96.2%
Fri 09-13 ( +0.14%) 96% Fri 07-27 (-1.54%) 94.8%
------------------------ ------------------------
Mon 09-16 ( +1.51%) 97% Mon 07-30 (+0.70%) 95.4%
Tue 09-17 ( -1.04%) 96% Tue 07-31 (-1.10%) 94.4%
Wed 09-18 ( +0.65%) 97% Wed 08-01 (+1.14%) 95.4%
Thu 09-19 ( -0.25%) 97% Thu 08-02 (+0.76%) 96.2%
Fri 09-20 ( -2.14%) 94% Fri 08-03 (-2.09%) 94.2%
------------------------ ------------------------
Mon 09-23 ( -0.84%) 94% Mon 08-06 (+2.18%) 96.2%
Tue 09-24 ( -1.78%) 92% Tue 08-07 (+0.26%) 96.5%
Wed 09-25 ( -0.01%) 92% Wed 08-08 (+1.14%) 97.6%
Thu 09-26 ( +0.96%) 93% Thu 08-09 (-2.83%) 94.8%
Fri 09-27 ( -3.11%) 90% Fri 08-10 (-0.23%) 94.6%
------------------------ ------------------------
Mon 09-30 ( -0.41%) 90% Mon 08-13 (-0.02%) 94.5%
Tue 10-01 ( -0.26%) 89% Tue 08-14 (-1.57%) 93.1%
Wed 10-02 ( +0.56%) 90% Wed 08-15 (-1.29%) 91.9%
Thu 10-03 ( -4.22%) 86% Thu 08-16 (-0.12%) 91.8%-minilow
Fri 10-04 ( -1.45%) 85%-minilow Fri 08-17 (+1.82%) 93.4%
------------------------ ------------------------
Mon 10-07 ( +6.32%) 90% Mon 08-20 (+0.32%) 93.7%
Tue 10-08 ( -0.21%) 90% Tue 08-21 (-0.23%) 93.5%
Wed 10-09 ( +0.48%) 90% Wed 08-22 (+1.11%) 94.5%
Thu 10-10 ( +1.79%) 92%-minipeak Thu 08-23 (-0.00%) 94.5%
Fri 10-11 ( -0.05%) 92% Fri 08-24 (+1.08%) 95.6%-minipeak?
------------------------ ------------------------
Mon 10-14 ( -0.49%) 92% Mon 08-27 (-0.42%) 95.2%
Tue 10-15 ( -1.06%) 91%
Wed 10-16 ( -3.20%) 88%
Thu 10-17 ( +1.70%) 89%
Fri 10-18 ( -2.51%) 87%
------------------ -----
Mon 10-21 ( -3.71%) 84%
Tue 10-22 ( +1.75%) 85%
Wed 10-23 ( -6.33%) 80%
Thu 10-24 ( -2.09%) 78% Black Thursday
Fri 10-25 ( +0.58%) 79%
------------------------
Mon 10-28 (-13.47%) 68% Black Monday
Tue 10-29 (-11.73%) 60%
Wed 10-30 (+12.34%) 67%
Thu 10-31 ( +5.82%) 71%
Fri 11-01 (Closed)
-----------------------
Mon 11-04 ( -5.79%) 67%
Tue 11-05 (Closed)
Wed 11-06 ( -9.92%) 60%
Thu 11-07 ( +2.61%) 62%
Fri 11-08 ( -0.70%) 62%
------------------------
Mon 11-11 ( -6.82%) 57%
Tue 11-12 ( -4.83%) 55%
Wed 11-13 ( -5.27%) 52%
Thu 11-14 ( +9.36%) 57%
Fri 11-15 ( +5.27%) 60%
1987 INTP


Post#2465 at 08-27-2007 10:19 PM by Matt1989 [at joined Sep 2005 #posts 3,018]
---
08-27-2007, 10:19 PM #2465
Join Date
Sep 2005
Posts
3,018


Post#2466 at 09-01-2007 02:39 PM by Matt1989 [at joined Sep 2005 #posts 3,018]
---
09-01-2007, 02:39 PM #2466
Join Date
Sep 2005
Posts
3,018

Bird Flu

http://abc.net.au/news/stories/2007/...?section=world

It is the nightmare possibility that health authorities have been fearing ever since the disease first appeared.

It happened in Indonesia last year and reveals the world only narrowly avoided a global bird flu pandemic.

Researchers from the University of Washington have studied the case of a woman on the Indonesian island of Sumatra who caught the H5N1 bird flu virus from poultry in May last year.

Professor Ira Longini, who led the research, says they have confirmed that not only did she pass the virus on to her 10-year-old nephew, it was then transmitted to other relatives.

Seven of eight family members who caught the disease were soon dead.

"This proves there is person-to-person transmission in this case, in that setting, in Indonesia, northern Sumatra," he said.

Professor Longini says this shows there is a serious threat of a bird flu pandemic.

"It could happen and will happen eventually, and this simply confirms this particular H5N1 virus is capable of person-to-person transmission," he said.

"The other thing it says is that we need to be very vigilant to find these clusters, to assess whether there's transmission and to stop transmission as quickly as we can each time they arise.

"We're going to see strains of influenza that are capable of causing pandemics arising, probably avian strains, and that will happen for sure, there's no doubt about it."

Fast-moving disease

Professor Longini says in this case, a pandemic may have been averted because of the quick action of health authorities or, statistically at least, it could have been luck.


Post#2467 at 09-02-2007 12:37 PM by GaudiaRay [at joined Aug 2007 #posts 33]
---
09-02-2007, 12:37 PM #2467
Join Date
Aug 2007
Posts
33

DJIA Chart still says this market is explosive

Your attention is called to the trading days of the week before last. Look at Monday and Tuesday.

http://bigcharts.marketwatch.com/qui...=djia&sid=1643

There are two inside trading days. They are evenly balanced and centered to each other and the prior, first of three trading days.

This is a dynamite triangle. It is the one clear indicator to me that the market is explosive. It could just dissipate and will over time if there is no move. Then the market will move but in ways uninterpretable to me.

The consequence of a DT is a move up to 3 times the length of the first bar, about 300+ pts above or below the top or bottom of the bar.

I yet await the action. Nothing in the subsequent 7 trading days has done anythhing to change the DT's impact. If there is no action within this next week, then the DT is a dud and other patterns control.

There are a second and third pattern also controlling, in this case direction. There is a reversal, the low bar, followed by the recovery bar and followed by inside days. This reversal is not climactic. It's what I call an internal reversal, as in not a long term trend reversal at a top or bottom relative a long period of time. The reversal is also very consequential. One can expect a move of between 1 times up the length of the reversal and recovery bars, 900 points above 13,350-13,400, to 14,250 - 14,300, or a move down of 1 to 5 times from the bottom of the recovery pattern, or 900 - 4500 pts below the 12,450 low, to 11,550 - 7,500. No meaningful movement has occurred yet on this pattern either.

And the last pattern is that of rising lows, marching up in even spacing, 6 days after the low, and again the last 3 days. This too portends explosiveness, as the market is trying to shake off something, in this case, the many piggy shorts who took the obvious position.

If the market rises, it will rise to 14,250 or so, and if it goes below 12,850, it will go to 11,500 to start and probably extend to 7,500. At this point, because I don't know how to straddle, and there is no reason to bet when the signals could be duds...with sideways trading as the "answer" to all this stress, letting it trade itself out and dissipate, I'm doing nothing but waiting for the market to define itself.

This Dynamite Triangle is the first I've seen in the DJIA in decades. It's a rare pattern.


Post#2468 at 09-02-2007 01:01 PM by mattzs [at joined Mar 2007 #posts 201]
---
09-02-2007, 01:01 PM #2468
Join Date
Mar 2007
Posts
201

Quote Originally Posted by GaudiaRay View Post
Your attention is called to the trading days of the week before last. Look at Monday and Tuesday.

http://bigcharts.marketwatch.com/qui...=djia&sid=1643

There are two inside trading days. They are evenly balanced and centered to each other and the prior, first of three trading days.

This is a dynamite triangle. It is the one clear indicator to me that the market is explosive. It could just dissipate and will over time if there is no move. Then the market will move but in ways uninterpretable to me.

The consequence of a DT is a move up to 3 times the length of the first bar, about 300+ pts above or below the top or bottom of the bar.

I yet await the action. Nothing in the subsequent 7 trading days has done anythhing to change the DT's impact. If there is no action within this next week, then the DT is a dud and other patterns control.

There are a second and third pattern also controlling, in this case direction. There is a reversal, the low bar, followed by the recovery bar and followed by inside days. This reversal is not climactic. It's what I call an internal reversal, as in not a long term trend reversal at a top or bottom relative a long period of time. The reversal is also very consequential. One can expect a move of between 1 times up the length of the reversal and recovery bars, 900 points above 13,350-13,400, to 14,250 - 14,300, or a move down of 1 to 5 times from the bottom of the recovery pattern, or 900 - 4500 pts below the 12,450 low, to 11,550 - 7,500. No meaningful movement has occurred yet on this pattern either.

And the last pattern is that of rising lows, marching up in even spacing, 6 days after the low, and again the last 3 days. This too portends explosiveness, as the market is trying to shake off something, in this case, the many piggy shorts who took the obvious position.

If the market rises, it will rise to 14,250 or so, and if it goes below 12,850, it will go to 11,500 to start and probably extend to 7,500. At this point, because I don't know how to straddle, and there is no reason to bet when the signals could be duds...with sideways trading as the "answer" to all this stress, letting it trade itself out and dissipate, I'm doing nothing but waiting for the market to define itself.

This Dynamite Triangle is the first I've seen in the DJIA in decades. It's a rare pattern.
I'm guessing it will be sideways to down, we have seen the intervention relief rally. The hedge fund redemption bomb is set to go off this month.
Dori: The terrorist has demanded a million dollars, a private jet and an end to the Star Wars program.
Sledge Hammer: Yeah, three movies was enough.
http://www.youtube.com/watch?v=irp8C...related&search=


Post#2469 at 09-03-2007 07:37 AM by John J. Xenakis [at Cambridge, MA joined May 2003 #posts 4,010]
---
09-03-2007, 07:37 AM #2469
Join Date
May 2003
Location
Cambridge, MA
Posts
4,010

Dear Gaudia,

Welcome to the Fourth Turning forum!

Quote Originally Posted by GaudiaRay View Post
> DJIA Chart still says this market is explosive

> Your attention is called to the trading days of the week before last.
> Look at Monday and Tuesday.

>
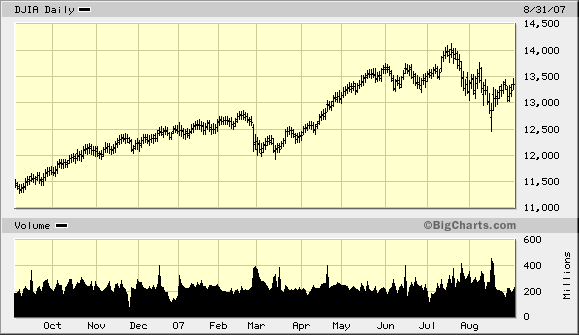
> http://bigcharts.marketwatch.com/quickchart/quickchart.asp?symb=djia&sid=1643

> There are two inside trading days. They are evenly balanced and
> centered to each other and the prior, first of three trading
> days.

> This is a dynamite triangle. It is the one clear indicator to me
> that the market is explosive. It could just dissipate and will
> over time if there is no move. Then the market will move but in
> ways uninterpretable to me.

> The consequence of a DT is a move up to 3 times the length of the
> first bar, about 300+ pts above or below the top or bottom of the
> bar.

> I yet await the action. Nothing in the subsequent 7 trading days
> has done anythhing to change the DT's impact. If there is no
> action within this next week, then the DT is a dud and other
> patterns control.

> There are a second and third pattern also controlling, in this
> case direction. There is a reversal, the low bar, followed by the
> recovery bar and followed by inside days. This reversal is not
> climactic. It's what I call an internal reversal, as in not a long
> term trend reversal at a top or bottom relative a long period of
> time. The reversal is also very consequential. One can expect a
> move of between 1 times up the length of the reversal and recovery
> bars, 900 points above 13,350-13,400, to 14,250 - 14,300, or a
> move down of 1 to 5 times from the bottom of the recovery pattern,
> or 900 - 4500 pts below the 12,450 low, to 11,550 - 7,500. No
> meaningful movement has occurred yet on this pattern either.

> And the last pattern is that of rising lows, marching up in even
> spacing, 6 days after the low, and again the last 3 days. This
> too portends explosiveness, as the market is trying to shake off
> something, in this case, the many piggy shorts who took the
> obvious position.

> If the market rises, it will rise to 14,250 or so, and if it goes
> below 12,850, it will go to 11,500 to start and probably extend
> to 7,500. At this point, because I don't know how to straddle, and
> there is no reason to bet when the signals could be duds...with
> sideways trading as the "answer" to all this stress, letting it
> trade itself out and dissipate, I'm doing nothing but waiting for
> the market to define itself.

> This Dynamite Triangle is the first I've seen in the DJIA in
> decades. It's a rare pattern.
I have to say that I always feel somewhat baffled by this kind of
analysis.

I think of it this way: Suppose someone discovered, by examining
historical data, that if the market goes down on Monday, and then it
rains on Tuesday, then the market goes up on Wednesday 55% of the
time.

Now, I'm certainly willing to believe that such patterns exist. But
these patterns are not much use to me unless I can identify a reason
for them -- in other words, create an abstract model that's "true" in
the real world, and predicts this and similar patterns.

So my question for you is: What do you believe is the reason why the
pattern you've described is valid?

I tend to refer to this kind of analysis as "short-term forecasting,"
to distinguish it from what I do ("long-term forecasting").
Short-term forecasting is highly date-specific, usually with
correctness probabilities not much higher than 50%. Long-term
forecasting has high correctness probabilities (near 100%), but only
within a wide date window, sometimes decades long. The research work
that I've been doing for five years, and documenting both here and on
my web site as I go along, is to find ways to combine short and long
term forecasting techniques to get predictions with high probability
of correctness (70-90%), within a narrow window (weeks or months).

My latest foray, defining a speculative model that appears to predict
a generational stock market crash in the September 10-21 time frame,
is highly daring for me, for obvious reasons.

However, I went ahead with it because it was unquestionably clear
that something has happened on July 19 and July 23 that is quite
spectacular: The market (DJIA) peaked on July 19, and then some kind
of "tipping point" clearly occurred on July 23 when the large mass of
investors turned from a "risk-seeking" or "risk-ignoring" behavior to
a "risk-aversive" pattern. There's no doubt that this occurred
massively, and was widely reported in the media.

I then speculated that we would follow a pattern in 2007 that would
mimic what happened in 1929, starting from the market peak.

What would be the reason why such a pattern might exist?

I did, in fact, post a model for this behavior on my web site. It
was contained in two paragraphs that I doubt that a single person
understood, but perhaps I can explain them now:

Quote Originally Posted by John J. Xenakis
> I'm imagining some kind of graph with two curves. One shows the
> arrogance of the Boomer generation, starting from their birth
> (1943-1960) and growing exponentially, slowly but surely. Their
> arrogance creates the dot-com bubble, the housing bubble, the
> credit bubble, the CDOs, etc.

> The second curve is the "anxiety and panic" curve. It starts
> much later -- around the mid-1990s -- but it grows at a faster
> exponential rate. The second curve caught up to the first one,
> and the two curves cross on this imaginary graph, on July 19 of
> this year. That crossover point is the tipping point. Seven or
> eight weeks later, according to this speculative theory, a stock
> market crash occurs.

** How to compute the 'real value' of the stock market.
http://www.generationaldynamics.com/cgi-bin/D.PL?d=ww2010.i.panic070820
This speculative model assumes that there are ways to measure such
things as "arrogance" and "anxiety" of the investor community, and
that the values of these measures grow with highly constant growth
rates, and that the values of those growth rates are independent of
time and place. That's a lot of assumptions, but there are reasons
to believe that this pattern has occurred more than once. (A web
site reader has looked at the South Sea Bubble of 1721, the panic of
1987, and the Asian LTCM collapse in 1998, and tells me that they
follow roughly the same pattern in roughly the same time frame.)

In our private communications, you've also pointed out a highly
interesting correlation: In 1929, there was a minor panic on March
26, a little over 5 months before the market reached its peak; in
2007, there was a minor panic on February 27, following a meltdown of
the Shanghai stock exchange. This was a little less than 5 months
before the market reached its peak. Thus, we have an additional
speculation involving "Peak minus 5 months."

Let me now throw in one more speculation that I haven't previously
posted: I refer to the Panic of 1987 as a "false panic" because the
market was underpriced at that time, as opposed to today when it's
overpriced by a factor of about 250% (same as in 1929). But it
recently dawned on me that 1987 was exactly 20 years ago, the length
of a Strauss and Howe generation. Furthermore, the 1929 crash was
preceded by the Panic of 1907, 22 years earlier. So we also have a
kind of "Crash minus one generation" speculation.

If any of these speculations turn out to be true, it would be a truly
remarkable situation, and it would provide strong support for a model
of the kind that I summarized in the two paragraphs that I quoted
earlier in this posting.

So now I return to your recent posting. If I understand what you're
saying, you seem to be claiming that something remarkable happened
last week that hasn't happened since 1929. I don't really understand
what you're claiming, or why it's so remarkable.

So could you explain it a bit further? Also, what are your
speculations about why such a pattern might turn out to be true?

Sincerely,

John

John J. Xenakis
E-mail: john@GenerationalDynamics.com
Web site: http://www.GenerationalDynamics.com


Post#2470 at 09-04-2007 10:24 AM by GaudiaRay [at joined Aug 2007 #posts 33]
---
09-04-2007, 10:24 AM #2470
Join Date
Aug 2007
Posts
33

Look at the daily chart of the DJIA.
I can't read everything but I can read stress in the market place.
Gross charting shows a declining tops scenario, which when crossed to the upside means the market could run up. I have zero knowledge of the statistical probability of this, but I do know that a series of higher bottoms is in this "marching" pattern always tells me there is something with high energy about to break out, typically up, based on that chart pattern alone. Not enough to bet on but enough to know the odds are more in that direction.

The explosive triangle, dynamite triangle, still has influence here as the days since it occurred are not many.

The trading patterns indicate indecision and fear. The best position is to do nothing because anything at all involves risk, is what the investors are thinking. But everyone knows the news.

I will guess some external event like the fall of 2 banks, like Barclays and Wells Fargo, on the same day, will trigger a collapse. If not, there's a technical rally that will result from all this stress evidencing trading.

Today, a move of 3 points, so far, an hour into trading, tells you something. It's a moment of fear, after everyone who wants to has taken their positions.

I am not taking any position other than gold and normally saleable assets in my mfg biz at this time.


Post#2471 at 09-04-2007 12:27 PM by John J. Xenakis [at Cambridge, MA joined May 2003 #posts 4,010]
---
09-04-2007, 12:27 PM #2471
Join Date
May 2003
Location
Cambridge, MA
Posts
4,010

Dear Gaudia,

Quote Originally Posted by GaudiaRay View Post
> Look at the daily chart of the DJIA.

> I can't read everything but I can read stress in the market
> place.

> Gross charting shows a declining tops scenario, which when crossed
> to the upside means the market could run up. I have zero knowledge
> of the statistical probability of this, but I do know that a
> series of higher bottoms is in this "marching" pattern always
> tells me there is something with high energy about to break out,
> typically up, based on that chart pattern alone. Not enough to bet
> on but enough to know the odds are more in that direction.

> The explosive triangle, dynamite triangle, still has influence
> here as the days since it occurred are not many.

> The trading patterns indicate indecision and fear. The best
> position is to do nothing because anything at all involves risk,
> is what the investors are thinking. But everyone knows the news.

> I will guess some external event like the fall of 2 banks, like
> Barclays and Wells Fargo, on the same day, will trigger a
> collapse. If not, there's a technical rally that will result from
> all this stress evidencing trading.

> Today, a move of 3 points, so far, an hour into trading, tells you
> something. It's a moment of fear, after everyone who wants to has
> taken their positions.
OK, let's completely forget the math and statistics. I understand
that you're telling us what your gut is telling you. I'd like to try
to understand what your gut is telling you.

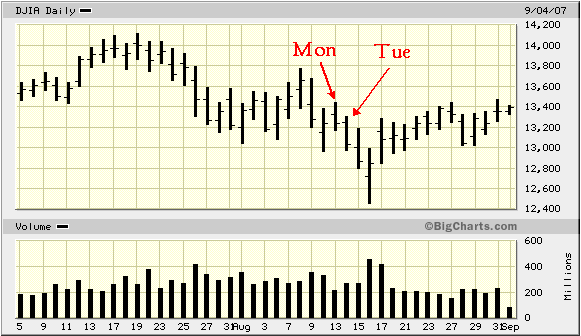
Here's another graph, zoomed in to one month, with the Monday and
Tuesday that you refer to labeled:


Now, what exactly is the "Dynamite Triangle"? Is it Mon-Tue-Wed? Is
it Fri-Mon-Tue? I can't tell.

And why is it so remarkable? Why is it so explosive? Don't these
kinds of patterns happen all the time?

Just tell me from your gut -- what's going on here, why is it
happening, and why is it important?

Quote Originally Posted by GaudiaRay View Post
> I am not taking any position other than gold and normally saleable
> assets in my mfg biz at this time.
This is a VERY good idea. A lot of people today are trying to "play"
this market either by going short or by adopting sophisticated timing
algorithms that they believe will get them out in time. What they
don't realize is that if their timing is off by even one day, then
they could lose everything -- even if they went short, because market
makers won't be able to fulfill their contracts, and even escrow
accounts will be lost.

Also, if you invest in gold, make sure that you take immediate
delivery of actual, physical gold, as you may not be able to get it
later.

Sincerely,

John

John J. Xenakis
E-mail: john@GenerationalDynamics.com
Web site: http://www.GenerationalDynamics.com
Last edited by John J. Xenakis; 09-04-2007 at 12:36 PM.


Post#2472 at 09-04-2007 02:20 PM by GaudiaRay [at joined Aug 2007 #posts 33]
---
09-04-2007, 02:20 PM #2472
Join Date
Aug 2007
Posts
33

John, it's the Friday, Monday, Tuesday following those with the arrows you've referenced. There is a flag or triangle and it's equadistant as it moves out. It is typically 3 days total, with a rare 4th day.

I'll challenge you to find this triangle on a daily basis in the DJIA over the past 50 years. I've looked in '88 through '92, and then stopped. This is rare and rare again.

It's explosive if the breakout occurs shortly. That's what history has shown when referencing large, freely trading markets which represent the views of the masses.


Post#2473 at 09-04-2007 02:59 PM by John J. Xenakis [at Cambridge, MA joined May 2003 #posts 4,010]
---
09-04-2007, 02:59 PM #2473
Join Date
May 2003
Location
Cambridge, MA
Posts
4,010

Dear Gaudia,

Quote Originally Posted by GaudiaRay View Post
> John, it's the Friday, Monday, Tuesday following those with the
> arrows you've referenced. There is a flag or triangle and it's
> equadistant as it moves out. It is typically 3 days total, with a
> rare 4th day.

> I'll challenge you to find this triangle on a daily basis in the
> DJIA over the past 50 years. I've looked in '88 through '92, and
> then stopped. This is rare and rare again.

> It's explosive if the breakout occurs shortly. That's what history
> has shown when referencing large, freely trading markets which
> represent the views of the masses.
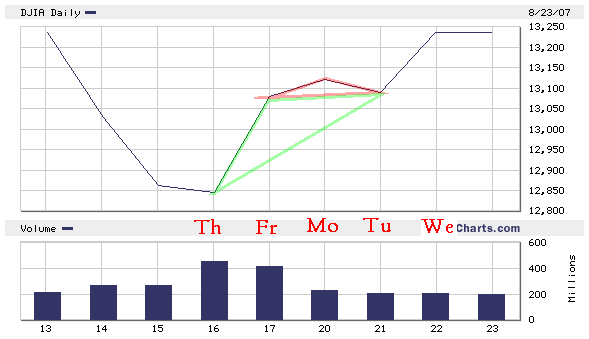
OK, here's the updated graph:


As you can see, I've drawn two triangles, one red and one green,
because I don't know what triangle you're referring to. Is it one of
these, or a different one?

Once I understand exactly what you're saying, I can write a Perl
program that will go through the Dow closing data back to 1928 to see
if any such similar pattern exists.

Sincerely,

John

John J. Xenakis
E-mail: john@GenerationalDynamics.com
Web site: http://www.GenerationalDynamics.com


Post#2474 at 09-04-2007 03:27 PM by GaudiaRay [at joined Aug 2007 #posts 33]
---
09-04-2007, 03:27 PM #2474
Join Date
Aug 2007
Posts
33

John,
It's the 17th, 20th and 21st, with the triangle being the daily highs and lows, being the tops and bottoms of the triangle.

Some triangles you find will not be equadistant. They will be "off", out of Fibonacci proportion. They have different outcomes.

This is a perfect dynamite triangle. Standing alone, it is impossible to tell the direction. When looking at chart action taking place at the same time, the directions can be guessed but not assuredly. Only subsequent market movement can tell us what direction this price change is going.

Thank you very much for seeking out this dynamite triangle in the DJIA.
Gaudia


Separately, the reversal bar took place on the 16th. The recovery was 17th and the compression bar, an inside bar, was on the 18th. When you divide volume into length of movement (high-low) ./. volume, you will see in those 3 days, another signal of price direction when it's applied to that small chart move, a much more commonly observed movement.

And separately yet again, we are witnessing a string of rising bottoms. If the market does not break down asap, it has a very high probability to shoot up, to get that upward biased pressure released.


Post#2475 at 09-04-2007 08:25 PM by John J. Xenakis [at Cambridge, MA joined May 2003 #posts 4,010]
---
09-04-2007, 08:25 PM #2475
Join Date
May 2003
Location
Cambridge, MA
Posts
4,010

Dear Gaudia,

Quote Originally Posted by GaudiaRay View Post
> It's the 17th, 20th and 21st, with the triangle being the daily
> highs and lows, being the tops and bottoms of the triangle.

> Some triangles you find will not be equadistant. They will be
> "off", out of Fibonacci proportion. They have different outcomes.

> This is a perfect dynamite triangle. Standing alone, it is
> impossible to tell the direction. When looking at chart action
> taking place at the same time, the directions can be guessed but
> not assuredly. Only subsequent market movement can tell us what
> direction this price change is going.

> Thank you very much for seeking out this dynamite triangle in the
> DJIA.
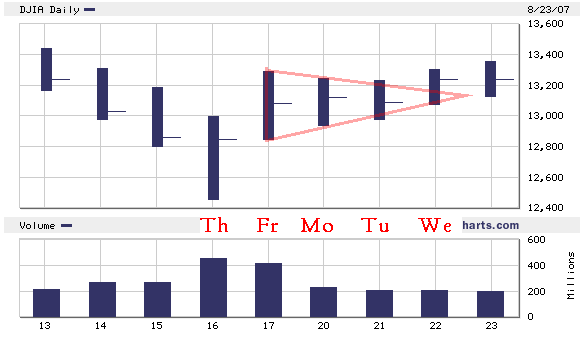
OK, here's the fourth try:


Do I have the correct triangle this time?

Quote Originally Posted by GaudiaRay View Post
> Separately, the reversal bar took place on the 16th. The recovery
> was 17th and the compression bar, an inside bar, was on the 18th.
> When you divide volume into length of movement (high-low) ./.
> volume, you will see in those 3 days, another signal of price
> direction when it's applied to that small chart move, a much more
> commonly observed movement.
Visual inspection of the above chart seems to indicate that
(high-low)/volume is approximately constant for the 3 days. Is that
what you mean?

Quote Originally Posted by GaudiaRay View Post
> And separately yet again, we are witnessing a string of rising
> bottoms. If the market does not break down asap, it has a very
> high probability to shoot up, to get that upward biased pressure
> released.
I think I understand this one.

Sincerely,

John

John J. Xenakis
E-mail: john@GenerationalDynamics.com
Web site: http://www.GenerationalDynamics.com
-----------------------------------------