Generational Dynamics
Fourth Turning Forum Archive


Popular links:
Generational Dynamics Web Site
Generational Dynamics Forum
Fourth Turning Archive home page
New Fourth Turning Forum

Thread: Global Warming - Page 61


Post#1501 at 12-14-2009 08:43 PM by Bob Butler 54 [at Cove Hold, Carver, MA joined Jul 2001 #posts 6,431]
---
12-14-2009, 08:43 PM #1501
Join Date
Jul 2001
Location
Cove Hold, Carver, MA
Posts
6,431

Left Arrow In Bolivia, Water and Ice Tell of Climate Change

The New York Times reports that In Bolivia, Water and Ice Tell of Climate Change

Glaciers are melting around the world. Glaciers have traditionally acted as reservoirs. Water is stored as ice during winter storm times, to be released as stream water in the summer. There has been concern as to what happens when the climate gets too warm for the natural ice reservoir system to work. There will be less water, as currently we are getting water flow from snow that may have fallen centuries ago. When that's gone, it's gone. The water flow will also be far more seasonal, with more water available in winter, less in the summer. Thus, there is apt to be a need for dams to even out the flow.

One sees a lot of articles saying this glacier is due to vanish in so many decades, that one in so many years. This article is about what happens when such countdowns reach zero.
Last edited by Bob Butler 54; 12-15-2009 at 11:11 AM. Reason: Tweak for Clarity


Post#1502 at 12-16-2009 08:50 PM by Bob Butler 54 [at Cove Hold, Carver, MA joined Jul 2001 #posts 6,431]
---
12-16-2009, 08:50 PM #1502
Join Date
Jul 2001
Location
Cove Hold, Carver, MA
Posts
6,431

Exclamation Scientific Goals May Be Missed by Copenhagen Climate Agreement

Bloomburg is reporting that Scientific Goals May Be Missed by Copenhagen Climate Agreement For discussion purposes...

Quote Originally Posted by Bloomberg
Dec. 17 -- World leaders taking control of stalled climate talks today in Copenhagen may find the measures acceptable to 193 nations fall short of what scientists demand to slow global warming.

Developed nations such as the U.S. and Japan may agree by tomorrow to cut greenhouse-gas emissions by about half what United Nations scientists said are needed to keep the planet from overheating. That’s a view shared by representatives of the Pew Center on Global Climate Change, Merrill Lynch & Co. and the European Commission, which represents 27 European nations.

The problem is that the 2 degrees C rise target the scientists are asking for would be just barely enough to keep Antarctica from thawing. If Antarctica thaws, that brings four more degrees with it. Such transitions have in the past resulted in major extinctions.

The Arctic is already thawing. Greenland is showing radically new melt patterns. Methane release from the Arctic permafrost is also starting...

People might manage to keep their blindfolds on for a while, but I'm still anticipating that the next bunch of prophets are going to be really ticked off at the planet we're leaving them with.


Post#1503 at 12-17-2009 05:05 PM by Justin '77 [at Meh. joined Sep 2001 #posts 12,182]
---
12-17-2009, 05:05 PM #1503
Join Date
Sep 2001
Location
Meh.
Posts
12,182

Quote Originally Posted by Bob Butler 54 View Post
The Arctic is already thawing.
Umm. Siberia isn't.

What's really fun is looking at the areas that the warmists' models leave blank (and then fill in with warming).


Here's an app that will give you raw data (direct from the Russian meterological service; their page) from 12-some-odd percent of the earth's land surface. Station list with coordinates. All those warming siberian regions turn out to have not been warming particularly much at all. In fact, stations not requiring downward-adjustment in recent times for UHI tend to show a very slight decline in temperatures. That dark, dark red spot over the Urals? Apparently fabrication.

I suppose people feel safe making blatantly counterfactual statements like 'the Arctic permafrost is melting', since they figure no one in their target audience will be able to check up on them. All hail the Inter Nets, for making things more accessible!
"Qu'est-ce que c'est que cela, la loi ? On peut donc être dehors. Je ne comprends pas. Quant à moi, suis-je dans la loi ? suis-je hors la loi ? Je n'en sais rien. Mourir de faim, est-ce être dans la loi ?" -- Tellmarch

"Человек не может снять с себя ответственности за свои поступки." - L. Tolstoy

"[it]
is no doubt obvious, the cult of the experts is both self-serving, for those who propound it, and fraudulent." - Noam Chomsky


Post#1504 at 12-17-2009 08:36 PM by Bob Butler 54 [at Cove Hold, Carver, MA joined Jul 2001 #posts 6,431]
---
12-17-2009, 08:36 PM #1504
Join Date
Jul 2001
Location
Cove Hold, Carver, MA
Posts
6,431

Left Arrow Siberia

Quote Originally Posted by Justin '77 View Post
Umm. Siberia isn't.

What's really fun is looking at the areas that the warmists' models leave blank (and then fill in with warming).

Here's an app that will give you raw data (direct from the Russian meteorological service; their page) from 12-some-odd percent of the earth's land surface. Station list with coordinates. All those warming siberian regions turn out to have not been warming particularly much at all. In fact, stations not requiring downward-adjustment in recent times for UHI tend to show a very slight decline in temperatures. That dark, dark red spot over the Urals? Apparently fabrication.

I suppose people feel safe making blatantly counterfactual statements like 'the Arctic permafrost is melting', since they figure no one in their target audience will be able to check up on them. All hail the Inter Nets, for making things more accessible!
The app wouldn't load. My lack of Russian language skills don't allow that path, anyway. This claim smelled as fishy as the other claims you have been making since Climategate. I thought I'd verify it using the Climate Data Visualiser link you provided.

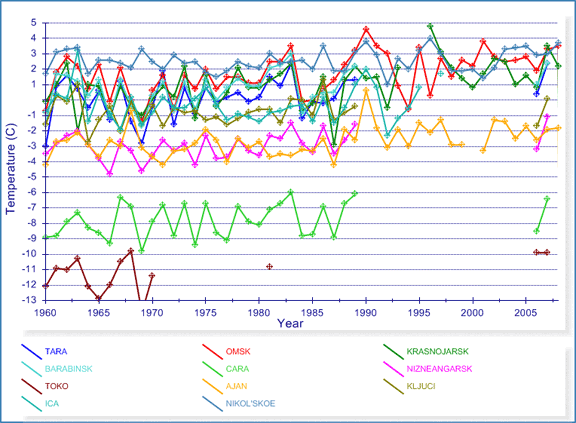
The following is the June through September mean temperature for sites between 70 W 150 E longitude, 55 N 57 N latitude. The longitude is the Climate Data Visualizer's default range for Siberia. The plot is of raw data. The latitude was chosen as it generated locations that were near zero in summer, and thus might be near the beginning of thawing. The latitude range is only 3 degrees as wider requests generated more graph lines than can be easily read. Before finding the thawing point latitude, I generated several similar graphs further north. The warming trend was similar.


From my side of the values divide, I am seeing a fairly steady 1 degree rise across the various stations and across the entire period. This translates to a 2 degree per century rate. Given that the Asian glaciers and the Arctic ice cap are both melting, I am not at all surprised by the temperature record.

Which is why I thought Justin's claim was fishy. That, and because most of the claims Justin has been making lately have proven fishy.

Now, in the process of chasing Climategate down, I've found myself visiting assorted global warming skeptic sties, distinctly partisan. It is very common to see claims of evidence that proves the skeptic perspective, and which support the existence of conspiracy theories in academic and government circles. Such forums are for the most part frequented by values blind people sharing the same flavor of blindness. Some of these people are making stuff up, perhaps in sincere attempts to forward a cause they truly believe in.

As long as they tell each other stuff that their values support, they believe it. The made up stuff gets shared as if it were truth. The values locked people might sincerely believe it is truth.

But, Justin, are you taking the time to verify any of this stuff you are posting to the T4T forum? Here we do have a wide variety of values. We won't automatically accept stuff which reinforces your values as we don't all share your values.

Now, your characterization of those who follow the main line science as making obscure claims that cannot be backed up by data is ludicrous... especially when you accompany it by an obscure false claim and link to a dysfunctional foreign language source for conformation.

I am trying to give you the benefit of the doubt. I am trying to assume you sincerely hold your professed values, and are quoting the false information trusting those who share your values. However, at this point you have forwarded enough bogus claims that I feel no great need to further prove that you are a bad source of information. You forward bad information without verifying it. I would request that in the future you dot your 'I's and cross your 'T's before sharing stuff from the partisan skeptic sites.

You seem to believe that partisan political sources provide better information the professional academic sources. This would be an extraordinary claim. It would require extraordinary proof. To date, you have been providing proof in the opposite direction.


Post#1505 at 12-17-2009 08:54 PM by Bri2k [at joined Aug 2007 #posts 133]
---
12-17-2009, 08:54 PM #1505
Join Date
Aug 2007
Posts
133

So assuming Global Warming is real, has anyone heard a truly workable solution? What are we supposed to do, go back to living like they did in the middle ages?

One thing that causes real credibility issues to average people is Global Warming hypocrites like Al Gore who have a personal carbon footprint larger than some small countries.

Anyone want to guess what "carbon-friendly" means of transportation practically all the delegates used to get to the Copenhagen conference? Airliners. How's that for a demonstration of principles?

Bri2k


Post#1506 at 12-17-2009 09:01 PM by Brian Rush [at California joined Jul 2001 #posts 12,392]
---
12-17-2009, 09:01 PM #1506
Join Date
Jul 2001
Location
California
Posts
12,392

Quote Originally Posted by Bri2k View Post
So assuming Global Warming is real, has anyone heard a truly workable solution? What are we supposed to do, go back to living like they did in the middle ages?
Change from burning fossil fuels to other sources of energy, of course. Start by improving energy efficiency. Currently it's running about 10%, meaning 90% of the energy generated by burning fossil fuels (or other sources) is thrown away rather than used. Increasing that to 40% would allow the consumption of one-quarter of the current resources to derive the same level of use.

Do that, and there will be plenty of green energy available from various sources to meet our needs.

One thing that causes real credibility issues to average people is Global Warming hypocrites like Al Gore who have a personal carbon footprint larger than some small countries.
That might cause real credibility issues towards Al Gore. You're not under the delusion that Gore is a climate scientist, are you? Or that he is the source of the global warming concept? Or that he, personally, provides any of the evidence for it at all? Or that if he, personally, was discredited one hundred percent, it would affect the science involved in the slightest degree?

Anyone want to guess what "carbon-friendly" means of transportation practically all the delegates used to get to the Copenhagen conference? Airliners. How's that for a demonstration of principles?
What other method would you suggest a person use to come from, say, Tokyo to Copenhagen? Walk? Swim?
"And what rough beast, its hour come round at last, slouches toward Bethlehem to be born?"

My blog: https://brianrushwriter.wordpress.com/

The Order Master (volume one of Refuge), a science fantasy. Amazon link: http://www.amazon.com/dp/B00GZZWEAS
Smashwords link: https://www.smashwords.com/books/view/382903


Post#1507 at 12-17-2009 09:11 PM by Bri2k [at joined Aug 2007 #posts 133]
---
12-17-2009, 09:11 PM #1507
Join Date
Aug 2007
Posts
133

Is it realistic to improve the efficiency of energy use to that level? If so, why haven't we done so already or at least made some progress in that direction?

As for Al Gore and the delegates to the climate summit, until they learn to "walk the talk" the public won't buy in. The fact that none of the delegates found a carbon-neutral way to get to Copenhagen makes this look like just another round of "do as we say, not as we do" which will become an increasingly untenable position the farther into 4T we go.

Bri2k


Post#1508 at 12-17-2009 09:33 PM by Brian Rush [at California joined Jul 2001 #posts 12,392]
---
12-17-2009, 09:33 PM #1508
Join Date
Jul 2001
Location
California
Posts
12,392

Quote Originally Posted by Bri2k View Post
Is it realistic to improve the efficiency of energy use to that level? If so, why haven't we done so already or at least made some progress in that direction?
Yes, it's totally realistic; the reason we haven't, is because energy was cheap enough that it wasn't worth doing in terms of return on investment, even though it was worth doing for environmental reasons. During the 1970s, under conditions of the OPEC oil embargo and scarce, expensive oil, energy efficiency did improve substantially. Since then, the progress has slowed, but for economic reasons rather than technological ones.

There's a point of diminishing returns, and 100% effiiciency is physically impossible. But I've seen studies (unfortunately not published on the net yet AFAIK) showing that a fourfold increase would be relatively easy and a ninefold one possible although it might not be worth doing.

As for Al Gore and the delegates to the climate summit, until they learn to "walk the talk" the public won't buy in.
Again, why are you saying this as if Gore or those politicians were in any way, shape or form an authority on the subject whose credibility mattered in the slightest? They're NOT. Gore is a politician, not a scientist. His credibility doesn't matter. Only the credibility of the scientific community matters, and that only in regard to their published work in the field.

You're bringing up total irrelevancies, and quite obviously using this not as an argument but as an excuse to believe what you want to believe.

The fact that none of the delegates found a carbon-neutral way to get to Copenhagen
I asked you before to explain what "carbon-neutral" way of traveling long distances they could have used. I'm asking you again. If you can't answer, then you're being unreasonable expecting the delegates to find a personal solution that doesn't exist, at least at this time. They're not engineers any more than they're scientists.
"And what rough beast, its hour come round at last, slouches toward Bethlehem to be born?"

My blog: https://brianrushwriter.wordpress.com/

The Order Master (volume one of Refuge), a science fantasy. Amazon link: http://www.amazon.com/dp/B00GZZWEAS
Smashwords link: https://www.smashwords.com/books/view/382903


Post#1509 at 12-17-2009 10:22 PM by Justin '77 [at Meh. joined Sep 2001 #posts 12,182]
---
12-17-2009, 10:22 PM #1509
Join Date
Sep 2001
Location
Meh.
Posts
12,182

Quote Originally Posted by Bob Butler 54 View Post
The app wouldn't load. My lack of Russian language skills don't allow that path, anyway. This claim smelled as fishy as the other claims you have been making since Climategate. I thought I'd verify it using the Climate Data Visualiser link you provided.
Weak excuse. The link I gave for the app is in english (and if you accidentally fell into the Russian version, there's a big british flag and the letters ENG for you to click on).

The CDV gives HADCRUT data. Of course, the argument made by the Russian organization is that HADCRUT cherry-picked a tiny sample from the 400-some-odd meteostations throughout the country. And that their cherry-picking leads to conclusions directly at odds with the data given by the stations as a whole, or by picking based on scientifically-valid criteria (like station longevity, avoidance of UHI, station quality, maximum coverage, or so forth).

So it makes sense that the cherry-picked data would give the result that people say they got from the cherry-picked data. You need to get the raw data to even see what the point is of the criticism. And it's there and open.

Of course, your dismissal of data in favor of ideology is par-for-the course.

Given that the Asian glaciers and the Arctic ice cap are both melting...
Of course, the Arctic cap is affected by undersea temps, and glaciers tend to melt for reasons other than heat (like, for example, increased friction loading). And the fact that evidence for widespread Asian glacier-melt is hardly what you would call solid.

Like, those say nothing about Siberia -- you know, the place where supposedly the bulk of AGWarming is actually happening?

Which is why I thought Justin's claim was fishy. That, and because most of the claims Justin has been making lately have proven fishy.
I assume by 'fishy', you mean 'contrary to dogma'. In which case, thank you. The fact that facts continue to back up the claims I bring up are really just icing on the cake of getting to be called a heretic by an Orthodox Believer.

But, Justin, are you taking the time to verify any of this stuff you are posting to the T4T forum?
Of course. Something I notice you have frequently (case in point right here) failed to do. Of course, there's nothing to be done about what another person chooses to do.

Now, your characterization of those who follow the main line science as making obscure claims that cannot be backed up by data is ludicrous... especially when you accompany it by an obscure false claim and link to a dysfunctional foreign language source for conformation.
Hardly dysfunctional... or foreign-language. It's all there for anyone who feels like maybe unscrewing the shutters on their eyes a tiny bit. Which you would have known, were you at all interested in finding out things that might challenge your preconceived worldview.

-------


In Bob's defense, I'm now hitting a 502 Proxy error trying to load this evening; I'm guessing the VNIIGMI-MTsD site is pretty overloaded now that its presence has been made known more publicly. I've contacted the webmaster there to find out what's up, but keep trying and you'll get through to the app.
Last edited by Justin '77; 12-17-2009 at 10:28 PM.
"Qu'est-ce que c'est que cela, la loi ? On peut donc être dehors. Je ne comprends pas. Quant à moi, suis-je dans la loi ? suis-je hors la loi ? Je n'en sais rien. Mourir de faim, est-ce être dans la loi ?" -- Tellmarch

"Человек не может снять с себя ответственности за свои поступки." - L. Tolstoy

"[it]
is no doubt obvious, the cult of the experts is both self-serving, for those who propound it, and fraudulent." - Noam Chomsky


Post#1510 at 12-18-2009 12:17 AM by The Grey Badger [at Albuquerque, NM joined Sep 2001 #posts 8,876]
---
12-18-2009, 12:17 AM #1510
Join Date
Sep 2001
Location
Albuquerque, NM
Posts
8,876

A Modest Proposal

Energy efficiency saves money. That should make it a plus in these times whether global warming exists or not.

Getting out of petroleum and into some other fuel source would do wonders for our foreign policy. No more wars for oil and/or suspicion that a given war is for oil. No more kissing up to desert kingdoms we wouldn't normally give the time of day to.

Refitting installations to be energy efficient isn't done in a vacuum or by little green men or outsourced to China. It's done on site by local workers. JOBS!!!!!

So we actually have three good hard reasons for cleaning up our act even so.

As for the climate conference attendees sucking up an enormous amount of energy and putting out an enormous amount of carbon - a not-too-serious thought. Out here in New Mexico we have an annual Hot Air Balloon Fiesta which is a great tourist attraction. Suppose there were some way to use the major product of international conferences to fill hundreds of beautiful balloons? And sell tickets?

The other major output of international confere4nces could be sold to the agricultural industry wholesale and in lawn & garden shops retail to increase crop productivity.
How to spot a shill, by John Michael Greer: "What you watch for is (a) a brand new commenter who (b) has nothing to say about the topic under discussion but (c) trots out a smoothly written opinion piece that (d) hits all the standard talking points currently being used by a specific political or corporate interest, while (e) avoiding any other points anyone else has made on that subject."

"If the shoe fits..." The Grey Badger.


Post#1511 at 12-18-2009 01:50 AM by Justin '77 [at Meh. joined Sep 2001 #posts 12,182]
---
12-18-2009, 01:50 AM #1511
Join Date
Sep 2001
Location
Meh.
Posts
12,182

Russian station database

The webmaster got back with me; apparently I guessed correctly, and their server has been absolutely slammed with requests. It was working consistently a couple minutes ago, and he says they are trying to get it 'stabilized'.

Here's what you should see:

"Qu'est-ce que c'est que cela, la loi ? On peut donc être dehors. Je ne comprends pas. Quant à moi, suis-je dans la loi ? suis-je hors la loi ? Je n'en sais rien. Mourir de faim, est-ce être dans la loi ?" -- Tellmarch

"Человек не может снять с себя ответственности за свои поступки." - L. Tolstoy

"[it]
is no doubt obvious, the cult of the experts is both self-serving, for those who propound it, and fraudulent." - Noam Chomsky


Post#1512 at 12-18-2009 02:08 AM by Brian Rush [at California joined Jul 2001 #posts 12,392]
---
12-18-2009, 02:08 AM #1512
Join Date
Jul 2001
Location
California
Posts
12,392

Ah, Justin, you never disappoint.

I'm not sure there's a name for that particular technique. I would call it "deluge people with a blizzard of data in a confusing format, preferably from an unreliable website, that will at best take hours to wade through and organize and at worst be completely inaccessible, in well-merited confidence that few, if any, will do so, and so make claims about it that few, if any, will ever be able to dispute." But that's rather a mouthful, and probably there's a pithier name for the same thing.

Cute, I must say.

Do you have any sources for your assertions that don't suffer from these drawbacks? BTW I was completely unable to access the data in question.
"And what rough beast, its hour come round at last, slouches toward Bethlehem to be born?"

My blog: https://brianrushwriter.wordpress.com/

The Order Master (volume one of Refuge), a science fantasy. Amazon link: http://www.amazon.com/dp/B00GZZWEAS
Smashwords link: https://www.smashwords.com/books/view/382903


Post#1513 at 12-18-2009 04:28 AM by Bob Butler 54 [at Cove Hold, Carver, MA joined Jul 2001 #posts 6,431]
---
12-18-2009, 04:28 AM #1513
Join Date
Jul 2001
Location
Cove Hold, Carver, MA
Posts
6,431

Left Arrow 502

Quote Originally Posted by Justin '77 View Post
In Bob's defense, I'm now hitting a 502 Proxy error trying to load this evening; I'm guessing the VNIIGMI-MTsD site is pretty overloaded now that its presence has been made known more publicly. I've contacted the webmaster there to find out what's up, but keep trying and you'll get through to the app.
Yep. I too was getting 502 Proxy. Clicking your three links I got a load error, a Russian language page and a list of stations with longitude and latitude that didn't included the data.

I instead switched to the same site your skeptic used to allege that 6 degree per century temperature rise. What? Climate Data Visualizer is good for accessing GHCN when it says something you want to hear, but is suddenly cherry picked fraud when it says something that conflicts with your values??? Can you say values lock?

Cherry picked? The Climate Data Visualizer allows access to 88 sites in its Siberia region. I didn't examine every single site, but in the process of finding the zone where things might be beginning to thaw, I checked about a third of them. The trend is pretty clear.

Where did you hear that Siberia isn't warming? Did you really verify it? Are you really ready to bet the shredded remains of your reputation for scientific integrity on the fact that Siberia isn't warming?


Post#1514 at 12-18-2009 06:13 AM by Bob Butler 54 [at Cove Hold, Carver, MA joined Jul 2001 #posts 6,431]
---
12-18-2009, 06:13 AM #1514
Join Date
Jul 2001
Location
Cove Hold, Carver, MA
Posts
6,431

Left Arrow Tara

OK. I got into the Russian site. It isn't nearly as convenient to use as the Climate Data Visualizer. It's pretty good for downloading daily or monthly data as text files, but I would have to start cut pasting stuff into spreadsheets which can get tedious.

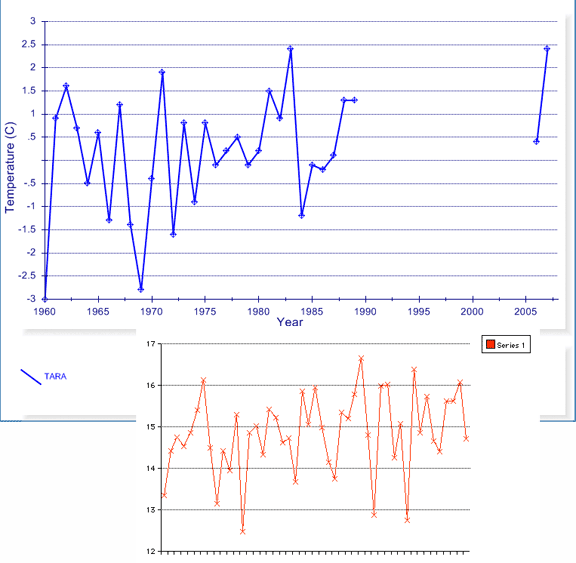
I did one check, late at night, just to get started. I selected one of the stations from that I'd already plotted from the Climate Data Visualizer, then tried to duplicate the same curve using the Russian data. DCV is on top in blue. The Russian data is on the bottom in red. The charts are raw data, 1960 to 2008, averaging June, July, August and September.


Both show clear warming.

The bumps are not lining up cleanly. While both are supposed to be the temperatures at Tara, either one of them is strongly adjusted, they are from a different station, or something. The over all warming trend is still there, but it doesn't look like the data really comes from the same station.

The Climate Data Visualizer lists Tara as station 22228493000, while Tara shows up on the Russian site as station 28493. CDV lists its all stations with 11 digits, while the Russian gives only 5 digits. The middle 5 digits matching exactly isn't a coincidence as other sites match names and numbers between the two web pages. (Well, we have Cara on one and Chara on the other. Close enough, I think.)

There is about a ten degree difference across the board. Perhaps the Climate Data Visualizer provides mean temperatures, while the Russian is giving max temperature? I'm just guessing, but the two sites are obviously reporting something different.

My next problem would be to download a statistically significant amount of station data in order to prove I'm not cherry picking just sites that show warming. The user interface is just too clumsy for me to want to bother.

Thus, I'm going to reverse the burden of proof. Justin has made the claim that Siberia isn't warming and that he has the data to prove it. My first simple not statistically significant check of his claim has shown the data doesn't support his claim. I've done enough spreadsheet work in the last few weeks that I figure it's Justin's turn. I'd like him to generate a criteria for selecting a representative sample of weather stations, and I'd like to see the result plotted out to show his allegedly flat trend.


Post#1515 at 12-18-2009 06:16 AM by Bri2k [at joined Aug 2007 #posts 133]
---
12-18-2009, 06:16 AM #1515
Join Date
Aug 2007
Posts
133

I'm not trying to argue with you or start a debate, Mr Rush, but as Al Gore is the most high-profile spokesman for global warming, his personal hypocrisy on the issue is indeed relevant.

Also, there are other modes of transportation available (sailing ships, anyone?) that the delegates could've used to get to Copenhagen. Unfortunately, those other means of travel may be inconvenient or require a lot of time and planning, but at this point, to be taken seriously, everyone pushing on Global Warming needs to be on message and lead by example. To do otherwise is to doom us to failure.

Bri2k


Post#1516 at 12-18-2009 06:25 AM by Bob Butler 54 [at Cove Hold, Carver, MA joined Jul 2001 #posts 6,431]
---
12-18-2009, 06:25 AM #1516
Join Date
Jul 2001
Location
Cove Hold, Carver, MA
Posts
6,431

Left Arrow Descriptive....

Quote Originally Posted by Brian Rush View Post
I'm not sure there's a name for that particular technique. I would call it "deluge people with a blizzard of data in a confusing format, preferably from an unreliable website, that will at best take hours to wade through and organize and at worst be completely inaccessible, in well-merited confidence that few, if any, will do so, and so make claims about it that few, if any, will ever be able to dispute." But that's rather a mouthful, and probably there's a pithier name for the same thing.
I can think of several concise and appropriate words that describe the above methodology, but Craig is trying to keep the site fairly clean.

I might or might not get ambitious over the next few days. I need a randomization service. Would someone (anyone) please give me a vaguely warm to hot month in the northern hemisphere, and a letter of the alphabet?


Post#1517 at 12-18-2009 11:23 AM by Brian Rush [at California joined Jul 2001 #posts 12,392]
---
12-18-2009, 11:23 AM #1517
Join Date
Jul 2001
Location
California
Posts
12,392

Quote Originally Posted by Bri2k View Post
I'm not trying to argue with you or start a debate, Mr Rush,
LOL of course you are. Don't be such a friggin' hypocrite.

but as Al Gore is the most high-profile spokesman for global warming, his personal hypocrisy on the issue is indeed relevant.
One must distinguish between science and politics. Also, between the messenger and the message. And finally, one must ask "relevant to what"? To Al Gore's personal reputation? Definitely. To the validity of AGW? Not in the slightest.

The data and theories underlying the AGW hypothesis (now well confirmed) come from many, many sources. Al Gore isn't even one of them, let alone all of them. He's just a messenger. If he were not only discredited, but vanished entirely, so that he had never existed, the validity of AGW would be completely unchanged.

If you mean that his credibility is "relevant" politically, in the sense that people are stupid and can be fooled by arguments based on that, then yes, unfortunately, you're right. That doesn't make such arguments valid, though.

I simply can't agree with you about the delegates traveling to Copenhagen. To begin with, time is of the essence, and using a method of transportation that will get them to the conference in a reasonable time is more important than an empty gesture like taking a sailboat. Secondly, the same argument applies to these guys as it does to Gore: they're not scientists, and their credibility on the issue is not important. It reflects on them, personally, but NOT on AGW as an idea.

And finally, let's understand what the problem and the goal is here. Is the earth, or the biosphere, threatened by global warming? No. The biosphere has done fine in the geological past at higher temperatures than we are likely to cause. WE are the ones threatened -- human civilization is threatened. One aspect of human civilization is ease of travel through flight. We don't want to give that up, we don't want to lose it, and if we change our overall energy economy away from fossil fuels, we will have enough room to use fossil fuels where there is no good substitute -- like jet airplanes.
"And what rough beast, its hour come round at last, slouches toward Bethlehem to be born?"

My blog: https://brianrushwriter.wordpress.com/

The Order Master (volume one of Refuge), a science fantasy. Amazon link: http://www.amazon.com/dp/B00GZZWEAS
Smashwords link: https://www.smashwords.com/books/view/382903


Post#1518 at 12-18-2009 04:17 PM by Justin '77 [at Meh. joined Sep 2001 #posts 12,182]
---
12-18-2009, 04:17 PM #1518
Join Date
Sep 2001
Location
Meh.
Posts
12,182

Bob,

I'll start with comments on your Tara graphs. The reason your numbers are nearly 10-degrees different is that the upper graph is showing (appears to be showing) something most definitely not summer temps. Summer temps in that part of the world run in the range of 10/20 degrees.. Since winter temps run in the range of -10/-20, the yearly average works out to right around zero.

By the way, Tara, since it appears in the CRU dataset, is exactly one of those cherry-picked stations that shows warming which is not characteristic of the climate trends in siberia as a whole. So the fact that it shows warming is... duh... completely noncontroversial.

For reference, Tara is a county seat (more or less) with a population of nearly 30,000. Like all Russian cities, it is very asphalt-heavy. So UHI is a definite factor. Particularly when one finds from Google Earth that the weather station is located inside the city itself. There's that cherry-picking for you. It'd be tough to argue that the modest increase in temperature there over the century reflects something other than urbanization.


If you want to have something to say -- be it criticism or confirmation -- you really need to have something better than a total cock-up pile of garbage for data. It's kind of sad that, having access to as many datasets as we now have, you seem to think that presenting two pictures of god-knows-what (you said yourself -- even you don't know what they are!) are an appropriate accompaniment to a reasoned argument.

Since you've expressed a distaste for finding answers if they are not handed to you on a platter (Brian did, too, but I'm not expecting to do science with him), I'll spend a chunk of time getting the siberian data graphed out.
"Qu'est-ce que c'est que cela, la loi ? On peut donc être dehors. Je ne comprends pas. Quant à moi, suis-je dans la loi ? suis-je hors la loi ? Je n'en sais rien. Mourir de faim, est-ce être dans la loi ?" -- Tellmarch

"Человек не может снять с себя ответственности за свои поступки." - L. Tolstoy

"[it]
is no doubt obvious, the cult of the experts is both self-serving, for those who propound it, and fraudulent." - Noam Chomsky


Post#1519 at 12-18-2009 05:41 PM by Brian Rush [at California joined Jul 2001 #posts 12,392]
---
12-18-2009, 05:41 PM #1519
Join Date
Jul 2001
Location
California
Posts
12,392

Quote Originally Posted by Justin '77 View Post
Brian did, too, but I'm not expecting to do science with him
You don't want to do science with anyone, Justin, and so any time you're talking, you're also not expecting to. Otherwise you wouldn't be talking.

Honestly, data that are accessible (meaning they show up on the screen when you hit the link), and that are presented in a way that doesn't require your reader to do your own work for you, isn't an unreasonable expectation. When you claim as you did that Siberia isn't thawing, and you present a link to data that you say supports this, it's not at all unreasonable to expect that you will at the very least point the way to which data to examine, and explain why those data are the ones to look at.

That would be a reasoned argument. What you did was simply a snow job.
"And what rough beast, its hour come round at last, slouches toward Bethlehem to be born?"

My blog: https://brianrushwriter.wordpress.com/

The Order Master (volume one of Refuge), a science fantasy. Amazon link: http://www.amazon.com/dp/B00GZZWEAS
Smashwords link: https://www.smashwords.com/books/view/382903


Post#1520 at 12-19-2009 02:58 PM by Bob Butler 54 [at Cove Hold, Carver, MA joined Jul 2001 #posts 6,431]
---
12-19-2009, 02:58 PM #1520
Join Date
Jul 2001
Location
Cove Hold, Carver, MA
Posts
6,431

Left Arrow Methodology

Quote Originally Posted by Justin '77 View Post
If you want to have something to say -- be it criticism or confirmation -- you really need to have something better than a total cock-up pile of garbage for data. It's kind of sad that, having access to as many datasets as we now have, you seem to think that presenting two pictures of god-knows-what (you said yourself -- even you don't know what they are!) are an appropriate accompaniment to a reasoned argument.
In the South Pacific, the skeptics would cherry pick a single station using CDV. If they found an adjustment that conflicted with their values, they would consider this proof of a conspiracy theory.

In Siberia, I duplicated your methodology. I used the CDV link which you provided. I used unadjusted data, as you reject adjusted data due to an alleged conspiracy theory. Of course, since what the unadjusted data shows is inconsistent with your values, you assert a need to adjust the data. Yes, there is a need to make adjustments, but which adjustments are to be made can't be selected on a values basis.

Justin, good science does not involve changing data sets and methodologies until you get the result you want. If one week you use a given set of data to reach a given result, do you really want to declare that data garbage shortly thereafter?

Quote Originally Posted by Justin '77 View Post
Since you've expressed a distaste for finding answers if they are not handed to you on a platter (Brian did, too, but I'm not expecting to do science with him), I'll spend a chunk of time getting the siberian data graphed out.
Could you start with methodology first? I'd like you to say how you are selecting your stations so as to avoid cherry picking.

I'll be interested in any tricks you use to get the Russian data graphed. Cut pasting enough stations from browser to spreadsheet to be statistically meaningful would be tedious. I'm looking to get a C compiler to streamline the process, to translate the monthly data into annual data that a spreadsheet can digest easier. At that point my distaste for the Russian data format ought to be reduced to a palatable level.


Post#1521 at 12-19-2009 05:02 PM by Bob Butler 54 [at Cove Hold, Carver, MA joined Jul 2001 #posts 6,431]
---
12-19-2009, 05:02 PM #1521
Join Date
Jul 2001
Location
Cove Hold, Carver, MA
Posts
6,431

Left Arrow M is for Murmansk

Quote Originally Posted by Bob Butler 54 View Post
I might or might not get ambitious over the next few days. I need a randomization service. Would someone (anyone) please give me a vaguely warm to hot month in the northern hemisphere, and a letter of the alphabet?
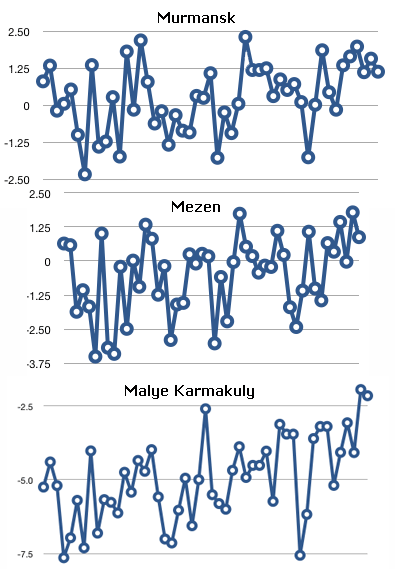
I figured a way to get the monthly data into a spreadsheet without too much trouble, so I'm no longer looking for a single month to work with. A yearly average seems the better choice.

As no one provided a letter of the alphabet, I am going with 'M'. I started out from the top of the Russian site looking for station names that begin with M. I intend to work my way down the list through the M stations. I got the first three Ms done when I came up with a hypothesis. The stations are sorted by station number. It is possible that the older stations have lower station numbers, thus the first three stations chosen might be older, better developed, and thus more asphalt prone than those lower down the list. Thus, should I get ambitious, the next few stations will be from the bottom of the list, and the next few from the middle.

Quote Originally Posted by Bob Butler 54 View Post
Could you start with methodology first? I'd like you to say how you are selecting your stations so as to avoid cherry picking.

I'll be interested in any tricks you use to get the Russian data graphed. Cut pasting enough stations from browser to spreadsheet to be statistically meaningful would be tedious. I'm looking to get a C compiler to streamline the process, to translate the monthly data into annual data that a spreadsheet can digest easier. At that point my distaste for the Russian data format ought to be reduced to a palatable level.
The following graphs are generated using the monthly data, asking for the semicolon divider, and cut pasting the result into a word processor. All graphs are for 1960 through 2008. I did a find and replace to change the semicolons into commas, saving the result with a .csv extension, then loading the .csv file into a spreadsheet.

For some stations, there are missing months and years. I've been filling in the holes with the same month's data from the previous year. This isn't ideal, but seems better than to average zeroes into the curve. I'm open to other suggestions.


The third M on the list was Murmansk, which is definitely not a rural wilderness station. That was what made me consider whether the list might be sorted in a non-random fashion.

Still, a trend seems visible.


Post#1522 at 12-19-2009 05:45 PM by Justin '77 [at Meh. joined Sep 2001 #posts 12,182]
---
12-19-2009, 05:45 PM #1522
Join Date
Sep 2001
Location
Meh.
Posts
12,182

The issue is Siberian stations, Bob. Murmansk isn't anywhere near Siberia. Nor is Mal. Karmakuly (it's on the west edge of Novaya Zemlya island, on the European side of the Urals). Nor is Mezen (Arkhangelsk oblast, on the edge of the White Sea not really terribly far from Murmansk).

I semi-arbitrarily (semi- in the sense that laziness drove me in part) limited 'Siberia' in my sample to Russian stations east of 70degE and north of 55degN. That's probably not the worst way to do it. It leaves us with 174 stations. We're not looking for brand-new ones, so I cut out the 41 of them that didn't go back to at least 1950. Which leaves us with 133 long-term stations just in Siberia.

For fun, compare that with the 121 stations the AGWarmists use for ALL OF RUSSIA.

Here's a map of the 133 stations that took me way too long to make.


I've been going through the process of Excel-manipulating the 1.2megs of data corresponding to those stations. "Tedious", I believe you called it... You will find no argument there.

I'm right now going the quick-n-lazy route of Jan-Dec yearly averages, eliminating any years missing months (for lack of a better way to avoid biasing the average). That's not bad, but since one of the things we're talking about is permafrost, I plan to also do a cold-6/warm-6 averaging to isolate 'summer' and 'winter' temps. But that's still a ways off.

What I am seeing so far is an interesting thing. As expected, the world has seen a long-term gradual warming trend which shows up in the overall slope of every graph's trend. BUT, when you look at the timeframe where -- according to AGW canon -- global warming took off and the siberian permafrosts started catastrophically melting, what I keep seeing over and over is a multi-decade level/cooling. There's no '1998-was-the-hottest-year' spikes at all, either. Which is kind of a big surprise to me, even.

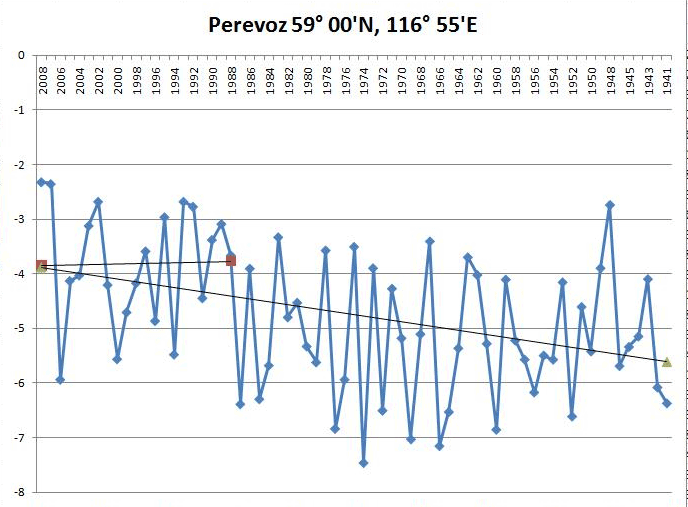
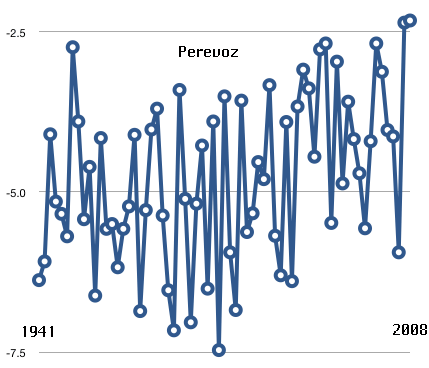
Here's four stations (fourth one on the next post; the forums software doesn't like more than four pics in a post) chosen for having been in the first few that I did (I started working backwards by station numbers).


Last edited by Justin '77; 12-19-2009 at 05:49 PM. Reason: spelling
"Qu'est-ce que c'est que cela, la loi ? On peut donc être dehors. Je ne comprends pas. Quant à moi, suis-je dans la loi ? suis-je hors la loi ? Je n'en sais rien. Mourir de faim, est-ce être dans la loi ?" -- Tellmarch

"Человек не может снять с себя ответственности за свои поступки." - L. Tolstoy

"[it]
is no doubt obvious, the cult of the experts is both self-serving, for those who propound it, and fraudulent." - Noam Chomsky


Post#1523 at 12-19-2009 05:48 PM by Justin '77 [at Meh. joined Sep 2001 #posts 12,182]
---
12-19-2009, 05:48 PM #1523
Join Date
Sep 2001
Location
Meh.
Posts
12,182

Fourth one


Assuming the trend I'm seeing holds (and so far, it seems to be), it seems to provide pretty good falsification of the repeated claim of catastrophically-melting Siberian permafrost. In fact, it looks like the multi-decade trend might even be for increasing permafrost!!
(Assuming, of course, that all permafrost needs is for things to be cold; there's almost certainly a lot more to it, so I really wouldn't try to hazard a guess as to whether it actually has. The sustained cooling it's been seeing, though, can't possibly hurt)

Then again, that claim was always presented without any kind of evidence, anyway...

More goodies as I bang through them.
Last edited by Justin '77; 12-19-2009 at 05:56 PM.
"Qu'est-ce que c'est que cela, la loi ? On peut donc être dehors. Je ne comprends pas. Quant à moi, suis-je dans la loi ? suis-je hors la loi ? Je n'en sais rien. Mourir de faim, est-ce être dans la loi ?" -- Tellmarch

"Человек не может снять с себя ответственности за свои поступки." - L. Tolstoy

"[it]
is no doubt obvious, the cult of the experts is both self-serving, for those who propound it, and fraudulent." - Noam Chomsky


Post#1524 at 12-19-2009 07:11 PM by Bob Butler 54 [at Cove Hold, Carver, MA joined Jul 2001 #posts 6,431]
---
12-19-2009, 07:11 PM #1524
Join Date
Jul 2001
Location
Cove Hold, Carver, MA
Posts
6,431

Left Arrow Evidence of a Mirror Reality?

Quote Originally Posted by Justin '77 View Post
The issue is Siberian stations, Bob. Murmansk isn't anywhere near Siberia. Nor is Mal. Karmakuly (it's on the west edge of Novaya Zemlya island, on the European side of the Urals). Nor is Mezen (Arkhangelsk oblast, on the edge of the White Sea not really terribly far from Murmansk)...

Here's a map of the 133 stations that took me way too long to make.
Could you provide a text list of those 133 stations? I might want to hit a few of them to make sure there is no cherry picking going on.

Quote Originally Posted by Justin '77 View Post
I've been going through the process of Excel-manipulating the 1.2megs of data corresponding to those stations. "Tedious", I believe you called it... You will find no argument there.
I might even suggest we use a stronger word than 'tedious.'

Quote Originally Posted by Justin '77 View Post
What I am seeing so far is an interesting thing. As expected, the world has seen a long-term gradual warming trend which shows up in the overall slope of every graph's trend. BUT, when you look at the timeframe where -- according to AGW canon -- global warming took off and the siberian permafrosts started catastrophically melting, what I keep seeing over and over is a multi-decade level/cooling. There's no '1998-was-the-hottest-year' spikes at all, either. Which is kind of a big surprise to me, even.
Quote Originally Posted by Justin '77 View Post
Assuming the trend I'm seeing holds (and so far, it seems to be), it seems to provide pretty good falsification of the repeated claim of catastrophically-melting Siberian permafrost. In fact, it looks like the multi-decade trend might even be for increasing permafrost!!

(Assuming, of course, that all permafrost needs is for things to be cold; there's almost certainly a lot more to it, so I really wouldn't try to hazard a guess as to whether it actually has. The sustained cooling it's been seeing, though, can't possibly hurt)

Then again, that claim was always presented without any kind of evidence, anyway...
The 1998 spike was a combination of near peak 11 year solar cycle with the mother of all El Nino seasons. I'm guessing that Siberia isn't effected very much by the Pacific Oscilation. Thus, I'm not surprised by the lack of El Nino effects. The prevailing winds in Siberia don't blow out of the South Pacific.

I too see the long term gradual warming trend. I'll add that I care most about 1960 and newer. That's when the hockey stick starts curving up. Before 1960s, temperature tends to follow solar effect.

I do note that the increasing solar heat in the first half of the 20th Century doesn't seem to have effected Siberia as much as the rest of the world. As a wild guess, the snow bounces a lot of the solar energy into space, so there is less effect?

I'm not seeing any "multi-decade level/cooling" since 1960. From my side of the values divide, the trend is broadly warming in the four charts I've seen thus far : Kirensk, Taishet, Ika and Perevoz. I really don't see how you are reading those charts as level or cooling.

Unless.... Those are years at the top of the charts? 2008 on the left for Perevoz, 1941 on the right? Thus, your charts should be read from right to left??? Most charts (including mine) show time progressing from left to right.(Must resist comment on values blindness. Must resist comment on values blindness....)

Based on the same data...

Justin's chart showing "multi-decade level/cooling"


My chart showing warming trend

I would not expect the start of thawing to show up on the temperature record. I guess if we want to further reduce the number of stations from 131, you may want to deal only with stations near or just north of the permafrost line. You might find the traditional 1950s permafrost line. If there are a bunch of stations around the same average yearly temperature near the traditional permafrost line, we might then have an average temperature where the permafrost is apt to survive. One might then look at where temperatures are at various stations north of that point and project a crude trend towards how much melting is apt to occur and how soon.
Last edited by Bob Butler 54; 12-19-2009 at 08:04 PM. Reason: Added Charts


Post#1525 at 12-19-2009 08:09 PM by Odin [at Moorhead, MN, USA joined Sep 2006 #posts 14,442]
---
12-19-2009, 08:09 PM #1525
Join Date
Sep 2006
Location
Moorhead, MN, USA
Posts
14,442

Justin's sophistry is getting tedious.
To recommend thrift to the poor is both grotesque and insulting. It is like advising a man who is starving to eat less.

-Oscar Wilde, The Soul of Man under Socialism
-----------------------------------------