They're easy to find by the 'north of' and 'east of' and 'age of' criteria I listed in my previous post. But since you asked nicely, I've cut-and-pasted my list at the bottom. Station number, name, lat, long format (for some reason you get the 'cent' character instead of 'minutes', although Excel reads either one just fine).Originally Posted by Bob Butler 54

I did on another thread and you got all 'Supreme Court' on meI might even suggest we use a stronger word than 'tedious.'
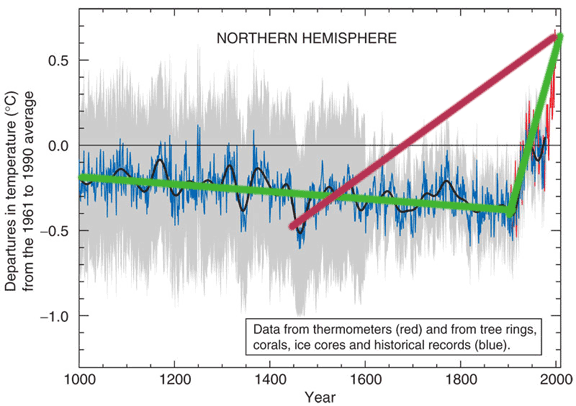
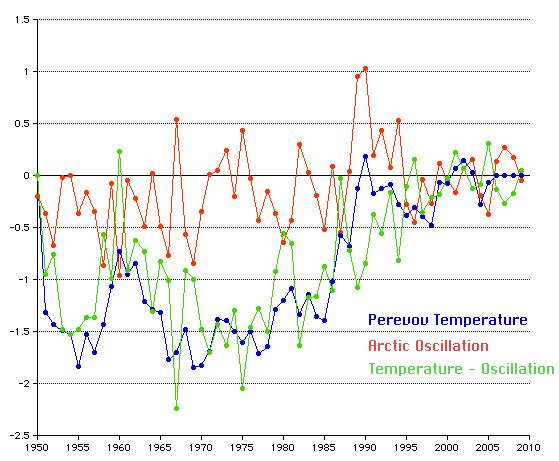
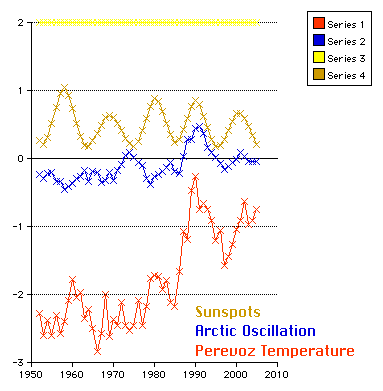
The AGWarmist line was that 1998 was "The Hottest Year Of The Century". It shows up as such in pretty much none of the Siberian data. It's not really important, either way -- just something I observed.The 1998 spike was a combination of near peak 11 year solar cycle with the mother of all El Nino seasons. I'm guessing that Siberia isn't effected very much by the Pacific Oscilation. Thus, I'm not surprised by the lack of El Nino effects. The prevailing winds in Siberia don't blow out of the South Pacific.
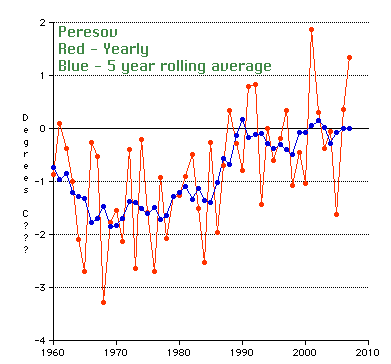
Except that in the Siberian ones I've gone through so far... it doesn't. It pokes up from 60-80, and then level or down from mid-80s through now. The AGWarmist line is currently working to hand-wave away the 2000's cooling trend, but the Siberian data seems to challenge even the 1990s AGW trend. IIRC, all their graphs show the real crazy near-vertical spiking happening mid-80s and 90s.I too see the long term gradual warming trend. I'll add that I care most about 1960 and newer. That's when the hockey stick starts curving up.
I don't know. Relatively warmer winter weather in the way-the-hell-north does tend to mean increased snowfall. Most of the time if it's crazy cold, its too cold to snow (and what's there, if it is thin, tends to sublimate away pretty fast). You'd have questions of cloudcover patterns, too.I do note that the increasing solar heat in the first half of the 20th Century doesn't seem to have affected Siberia as much as the rest of the world. As a wild guess, the snow bounces a lot of the solar energy into space, so there is less effect?
It's an interesting question that probably would justify a chunk of study. Of course, it also highlights another fatal flaw in GCMs.
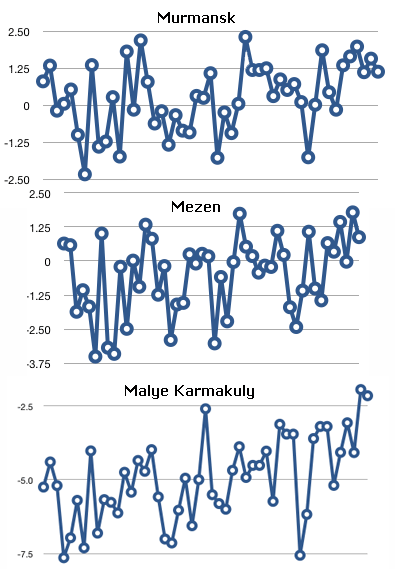
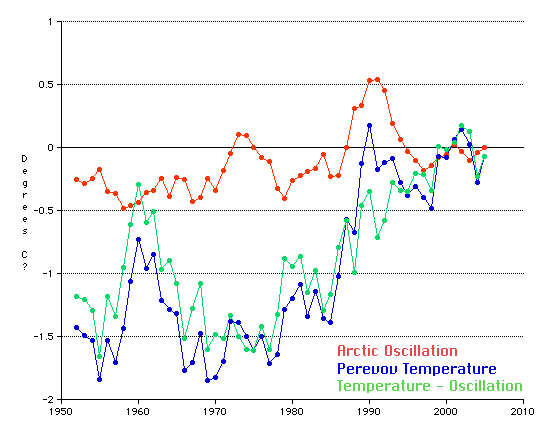
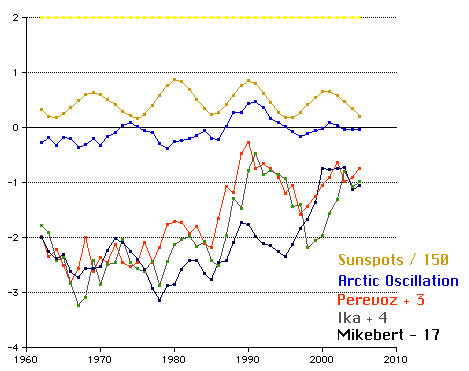
See the trend lines. That's what they are there for. Those four stations have a quick spike of warming in the early-to-mid 80s, and then 2+ decades of cooling up to today. That is, even notwithstanding the current decade which AGWarmers accept is a cooler one, they also cooled during the one that supposedly saw warming worldwide.I'm not seeing any "multi-decade level/cooling" since 1960. From my side of the values divide, the trend is broadly warming in the four charts I've seen thus far : Kirensk, Taishet, Ika and Perevoz. I really don't see how you are reading those charts as level or cooling.
Plus, the 'melting permafrost' claim certainly pertains to the last twenty years.
Yeah. Sorry about that. I flipped all the data upside-down so I could have the same physical starting point (cell C4) for January 2008 on every record. It makes data analysis a lot easier, especially when we don't really care in a lot of detail about what happened in 1846. I found out how to turn the x-axis around... but not until after I had already posted the pictures.Unless.... Those are years at the top of the charts? 2008 on the left for Perevoz, 1941 on the right? Thus, your charts should be read from right to left??? Most charts (including mine) show time progressing from left to right.
Future graphs will no longer be oriented ass-backwards.
That's a good idea. If you don't mind, I'm going to get the bulk processing done on all the stations first before I go into that kind of detail.I guess if we want to further reduce the number of stations from 131, you may want to deal only with stations near or just north of the permafrost line. You might find the traditional 1950s permafrost line. If there are a bunch of stations around the same average yearly temperature near the traditional permafrost line, we might then have an average temperature where the permafrost is apt to survive. One might then look at where temperatures are at various stations north of that point and project a crude trend towards how much melting is apt to occur and how soon.
My "long-term Siberian" station list:
20069 Визе 79° 30¢ 76° 59¢ 20087 Голомянный 79° 33¢ 90° 37¢ 20289 Русский 77° 10¢ 96° 26¢ 20292 Им.Е.К.Федорова,ГМО 77° 43¢ 104° 18¢ 20476 Стерлегова 75° 25¢ 88° 54¢ 20667 Им. М.В.Попова 73° 20¢ 70° 03¢ 20674 Диксон 73° 30¢ 80° 24¢ 20891 Хатанга 71° 59¢ 102° 28¢ 20982 Волочанка 70° 58¢ 94° 30¢ 21432 Котельный 76° 00¢ 137° 52¢ 21647 Шалаурова 73° 11¢ 143° 14¢ 21802 Саскылах 71° 58¢ 114° 05¢ 21824 Тикси 71° 35¢ 128° 55¢ 21908 Джалинда 70° 08¢ 113° 58¢ 21921 Кюсюр 70° 41¢ 127° 24¢ 21946 Чокурдах 70° 37¢ 147° 53¢ 21982 Остров Врангеля 70° 59¢ 181° 31¢ 23074 Дудинка 69° 24¢ 86° 10¢ 23256 Тазовск 67° 28¢ 78° 44¢ 23274 Игарка 67° 28¢ 86° 34¢ 23345 Ныда 66° 38¢ 72° 56¢ 23365 Сидоровск 66° 36¢ 82° 18¢ 23383 Агата 66° 53¢ 93° 28¢ 23472 Туруханск 65° 47¢ 87° 56¢ 23552 Тарко-Сале 64° 55¢ 77° 49¢ 23662 Толька 63° 59¢ 82° 05¢ 23678 Верхнеимбатск 63° 09¢ 87° 57¢ 23867 Ларьяк 61° 06¢ 80° 15¢ 23884 Бор 61° 36¢ 90° 01¢ 23891 Байкит 61° 40¢ 96° 22¢ 23946 Угут 60° 30¢ 74° 01¢ 23955 Александровское 60° 26¢ 77° 52¢ 23986 Северо-Енисейский 60° 23¢ 93° 02¢ 24105 Ессей 68° 28¢ 102° 22¢ 24125 Оленек 68° 30¢ 112° 26¢ 24136 Сухана 68° 37¢ 118° 20¢ 24143 Джарджан 68° 44¢ 124° 00¢ 24266 Верхоянск 67° 34¢ 133° 24¢ 24329 Шелагонцы 66° 15¢ 114° 17¢ 24343 Жиганск 66° 46¢ 123° 24¢ 24371 Усть-Чаркы 66° 48¢ 136° 41¢ 24382 Усть-Мома 66° 27¢ 143° 14¢ 24507 Тура 64° 16¢ 100° 14¢ 24641 Вилюйск 63° 47¢ 121° 37¢ 24661 Сеген-Кюель 64° 00¢ 130° 18¢ 24671 Томпо 63° 57¢ 135° 52¢ 24679 Восточная 63° 13¢ 139° 36¢ 24688 Оймякон 63° 15¢ 143° 09¢ 24738 Сунтар 62° 09¢ 117° 39¢ 24790 Сусуман 62° 47¢ 148° 10¢ 24802 Стрелка Чуня 61° 45¢ 102° 48¢ 24817 Ербогачен 61° 16¢ 108° 01¢ 24908 Ванавара 60° 20¢ 102° 16¢ 24923 Ленск 60° 43¢ 114° 53¢ 24951 Исить 60° 49¢ 125° 19¢ 24959 Якутск 62° 01¢ 129° 43¢ 24966 Усть-Мая 60° 23¢ 134° 27¢ 24967 Тегюльтя 60° 28¢ 130° 00¢ 25034 Амбарчик бухта 69° 37¢ 162° 18¢ 25042 Остров .Айон 69° 56¢ 167° 59¢ 25138 Островное 68° 07¢ 164° 10¢ 25173 Мыс Шмидта 68° 54¢ 180° 38¢ 25206 Среднеколымск 67° 27¢ 153° 43¢ 25248 Илирней 67° 15¢ 167° 58¢ 25325 Усть-Олой 66° 33¢ 159° 25¢ 25356 Эньмувеем 66° 23¢ 173° 20¢ 25399 Уэлен 66° 10¢ 190° 10¢ 25400 Зырянка 65° 44¢ 150° 54¢ 25428
Омолон 65° 14¢ 160° 32¢ 25503 Коркодон 64° 45¢ 153° 58¢ 25538 Верхне-Пенжино 64° 13¢ 164° 14¢ 25551 Марково 64° 41¢ 170° 25¢ 25563 Анадырь 64° 47¢ 177° 34¢ 25594 Бухта Провидения 64° 25¢ 186° 46¢ 25621 Кедон 64° 00¢ 158° 55¢ 25656 Березово 63° 27¢ 172° 42¢ 25703 Сеймчан 62° 55¢ 152° 25¢ 25705 Среднекан 62° 27¢ 152° 19¢ 25744 Каменское 62° 29¢ 166° 13¢ 25777 Гавриила бухта 62° 25¢ 179° 08¢ 25913 Магадан 59° 33¢ 150° 47¢ 25927 Брохово 59° 39¢ 154° 16¢ 25932 Тайгонос 60° 41¢ 160° 24¢ 25954 Корф 60° 21¢ 166° 00¢ 25956 Апука 60° 26¢ 169° 40¢ 28493 Тара 56° 54¢ 74° 23¢ 28698 Омск 55° 01¢ 73° 23¢ 29023 Напас 59° 51¢ 81° 57¢ 29111 Средний Васюган 59° 13¢ 78° 14¢ 29154 Усть-Озерное 58° 53¢ 87° 45¢ 29231
Колпашево 58° 18¢ 82° 53¢ 29263
Енисейск 58° 27¢ 92° 09¢ 29282 Богучаны 58° 23¢ 97° 27¢ 29313 Пудино 57° 34¢ 79° 26¢ 29328 Бакчар 57° 00¢ 82° 04¢ 29348 Первомайское 57° 04¢ 86° 13¢ 29418 Северное 56° 20¢ 78° 22¢ 29467 Ачинск, ж.д.ст. 56° 17¢ 90° 31¢ 29539
Болотное 55° 40¢ 84° 24¢ 29541 Тайга 56° 04¢ 85° 37¢ 29557
Тисуль 55° 45¢ 88° 18¢ 29570
Красноярск, оп.п. 56° 02¢ 92° 45¢ 29580 Солянка 56° 10¢ 95° 16¢ 29594 Тайшет 55° 57¢ 98° 00¢ 29605 Татарск 55° 13¢ 75° 58¢ 29612 Барабинск 55° 20¢ 78° 22¢ 30028
Ика 59° 17¢ 106° 10¢ 30054 Витим 59° 27¢ 112° 35¢ 30069 Перевоз 59° 00¢ 116° 55¢ 30089 Джикимда 59° 01¢ 121° 46¢ 30219 Максимово 57° 06¢ 104° 58¢ 30230 Киренск 57° 46¢ 108° 04¢ 30309 Братск 56° 17¢ 101° 45¢ 30328 Орлинга 56° 03¢ 105° 50¢ 30372 Чара 56° 54¢ 118° 16¢ 30385 Усть-Нюкжа 56° 35¢ 121° 29¢ 30433 Нижнеангарск 55° 47¢ 109° 33¢ 30437 Карам 55° 09¢ 107° 37¢ 30471 Средний Калар 55° 52¢ 117° 22¢ 30493 Нагорный 55° 58¢ 124° 53¢ 31004 Алдан 58° 37¢ 125° 02¢ 31026 Учур 58° 44¢ 130° 37¢ 31062 Югаренок 59° 46¢ 137° 40¢ 31088 Охотск 59° 22¢ 143° 12¢ 31137 Токо 56° 17¢ 131° 08¢ 31152
Нелькан 57° 39¢ 136° 09¢ 31168 Аян 56° 27¢ 138° 09¢ 32252 Усть-Воямполка 58° 30¢ 159° 10¢ 32287 Усть-Хайрюзово 57° 05¢ 156° 42¢ 32363 Эссо 55° 55¢ 158° 43¢ 32389 Ключи 56° 19¢ 160° 50¢ 32411 Ича 55° 35¢ 155° 35¢ 32618 Остров Беринга 55° 12¢ 165° 59¢
---
Edit: crap. I lost formatting on the list. Trust me, it was a beautiful set of rows and columns before I hit 'submit'. I can re-try if you want, although it is technically all there... and this way takes up less space
- Join Date
- Sep 2001
- Location
- Meh.
- Posts
- 12,182

 Read a book.